![how-to-collect-data-for-product-management-analytics-and-act-on-it?-[best-tools-included]](https://prodsens.live/wp-content/uploads/2022/08/2391-how-to-collect-data-for-product-management-analytics-and-act-on-it-best-tools-included-550x360.png)
Do you implement product management analytics from the onset of a product launch to understand user behavior and timely improve the product based on the findings?
If so, where should you begin? What metrics should you track to turn them into actionable insights?
This piece will guide you through all the crucial steps of product analytics, from finding important customer data to using various product management analytics tools.
Ready to dive into product management analytics? Let’s get started!
TL;DR
- Product management analytics revolves around the understanding of user behavior across your product. Specifically, it gives your data to answer what users actually do in the product instead of what they say they do.
- Multiple teams need to gauge product analytics data. Product managers — for making strategic decisions. Product marketers — for identifying new opportunities.
- Customer success teams — for understanding customers’ needs. UX designers and developers — for making improvements to the product.
- Common product management metrics to track enlist:
– Engagement metrics (Average Daily Active Users, NPS score, product adoption rate, and product stickiness)
– Conversion metrics (visitor to sign up, trial to paid conversion rate, Marketing Qualified Leads to Sales Qualified Leads conversion rate, Product Qualified Leads to Sales Qualified Leads conversion rate)
– Retention metrics (retention rate, Customer Lifetime Value, Monthly Recurring Revenue, churn rate) - You can collect data in these ways: segmenting users based on specific user and behavioral characteristics (customer behavioral segmentation), conducting cohort and funnel analysis to find out conversion and drop-off points, and carrying out retention analysis to understand how and why users churn.
- You can use Userpilot to carry out customer behavioral segmentation, A/B-testing feature adoption, creating onboarding flows, or detecting friction points across the product. Book a demo to see Userpilot in action.
- Choose Mixpanel to analyze both your site and your product. Track each step of how users progress through the customer journey from different traffic sources (e.g., social media and organic traffic).
- Finally, Amplitude will help you with behavioral reports to understand user engagement within your product.
What is product management analytics?
Product management analytics revolves around the understanding of user behavior across your product. What obstacles do they encounter in the user journey, or what do they find exciting about your product? Product analytics helps product managers answer these questions and make informed decisions about product adjustments.
Why are product management analytics important?
Product management analytics shows companies how their customers behave. Specifically, what users are actually doing in the product rather than what they say they are doing. Building an efficient and profitable product begins with understanding customers’ needs.
Here are a few examples of how a product manager might use analytics:
- Identify a bug causing users to quit and/or reduce total time on the app/site.
- Evaluate the success of the new feature based on the feature adoption rate.
- Discover gaps in the user flow that might be contributing to a long time-to-value.
Who needs product management analytics?
Almost every department in SaaS businesses needs to access product analytics data. Product managers convert collected metrics to product improvements. In turn, product marketers make use of product data to understand customer pain points and address product features as a solution.
Other departments also use data analytics to hone the overall customer experience.
At this point, let’s get more granular and learn how different roles act on product data.
Product managers — for making strategic decisions
At its heart, a product manager is responsible for defining a product’s vision and the strategy for achieving that vision. However, it’s impossible to do unless you know how users progress through the customer journey and what steps they drop off and why.
In addition, product teams gather such data as Net Promoter Score (NPS), customer satisfaction score, or time to the first value to be able to detect tricky spots in product adoption.
As a result, if product management teams lack product metrics, they perform like helpless newborn kittens.
Product marketers — for identifying new opportunities
A product marketing team may use product management analytics to observe what features customers use the most and why to tailor product marketing messaging and positioning to gain relevant traffic.
Marketers also utilize product analytics metrics to hone the pre-onboarding experience to improve the conversion rate from visitors to signups.
Customer success teams — for understanding customers’ needs
Customer success teams can use product management analytics to see how users behave in the app and what they do. They can use that data to understand customers on a deeper level to timely offer help to increase customer lifetime value, customer loyalty, or upgrade/upsell a user.
For instance, they can track customer segments running out of limits and reach out to them with a sweet deal to upgrade their plan. They can also examine how many customers adopt the product and, if the numbers are not good, find and fix the problem.
UX designers and developers — for making improvements to the product
One clumsy field or non-user-friendly dropdown in the sign-up form may cause a terrifying drop in signups, as it once happened with ClassHero. Their bad UX led to 48% of customers’ loss!
To predict such situations, UX/UI designers can use different product analytics tools to observe how users engage with the product and what areas of the interface they consider insufficient.
Important product management analytics metrics
Now that we know how beneficial product data analytics is for the overall product strategy and business growth, let’s learn what common metrics product managers have to track except OKRs and KPIs to make a real impact on the business performance.

Engagement metrics
Does your product help get the job done? What percentage of active users becomes selected or paid customers? Engagement metrics provide insights into how many users actually use your product and derive value from it.
- Average daily active users (ADAU): This metric tells you how many users engage with your product on a given day. If there’s stagnation (or worse — a drop), you have to immediately take action and find out what caused the leak to be able to patch it up.
- Product stickiness will tell you for how long customers stay with your product from day one and engage with it so that you can gauge the likeability of your product.
- Product adoption rate shows how many new customers progress through the product adoption curve and how fast they understand product value (reach the “Aha!” moment and become activated).
- NPS score reveals pain points on different customer journey stages. You can measure the level of customer satisfaction with a particular feature or the overall experience with your product, company, or customer support.
Conversion metrics
SaaS conversion metrics tell you whether your current product marketing strategy and onboarding process are up to par.
- The visitor to sign up: Gauge this data to understand what percentage of monthly visitors converts to new signups. A benchmark for SaaS companies lies between 2% to 5%.
- Trial to paid conversion rate: Product managers must track this metric because it is crucial to the business. The trial to paid conversion rate is the number of people who decided to buy the product after trying it. In the B2B sector, the industry average is between 14-25%. Product teams can improve this by honing onboarding and the overall user experience across the product.
- MQL to SQL conversion rate: The MQL to SQL conversion rate is the percent of marketing qualified leads that become sales qualified leads.
- PQL to SQL conversion rate: PQL to SQL conversion rate refers to existing free trial or freemium users who have adopted some features and may likely become paying customers.
Retention metrics
SaaS customer retention metrics are one of the essential business metrics in product analytics to keep an eye on. They explicitly describe how healthy your business is and for how long you will remain profitable.
- Retention rate is the percentage of users you retain over a period of time. These are customers who subscribed for a specific amount of time and then resubscribed for your product or service.
- Customer lifetime value is a forecast of how much money one single customer generates during the period of product usage.
- Monthly recurring revenue (MRR) is the predictable total revenue generated by your business from all active subscriptions during a particular month. It includes recurring charges from discounts, coupons, and add-ons, but excludes one-time charges.
- Churn rate is a metric of paramount importance to track because this pinpoints the amount of churned customers per month.
4 different product management analyses to collect data and act on it
Data collection is the first step in the product analytics process. To make this process easier, we’ve prepared four methods to extract data.
Let’s dive in.
Segment users into groups based on behavioral characteristics
By segmenting users based on specific user and behavioral characteristics, you can create better product experiences and more effective market positioning.
We recommend using Userpilot to create such kind of segmentation. This product management analytics tool allows you to segment customers by demographics, in-app behavior, user attributes, NPS, etc.
For example, we can create a specific segment of active users with a low NPS score (>7) who completed the onboarding checklist. Thus, we will create a group of customers who have probably reached the activation point but were not satisfied with our product.
Customer behavioral segmentation can also help product managers replicate the patterns for your best users.

Conduct cohort analysis to understand the logic behind users’ behavior
Unlike customer behavioral segmentation, cohort analysis helps you examine a group of customers with specific characteristics over a long period of time (e.g., a month or quarter). This allows a product manager to watch how one or the other product update impacted specific product management analytics metrics.
For example, you might want to gauge how improvements in the onboarding flow affected its completion rate for different user groups.
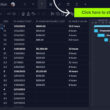
Alternatively, you can apply cohort analysis to detect what user segments churn the most and dig deeper to see why drop-off happens (check out the screenshot below).

Conduct funnel analysis to find out conversion and drop-off points
Funnel analysis is your next step after finalizing cohort analysis. Once you spot a month with a high churn rate, it’s reasonable to identify what stage of the user’s journey caused the drop-off. Thus you can make improvements.
With funnel analysis, you can also identify the steps users follow along the path to key events like:
- Registration
- Initial conversion
- Activation
- Upgrade

Conduct retention analysis to understand how and why users churn
Again, if a product manager identifies the issue in the retention metrics, they carry out retention analysis as a logical extension.
This product analytics method reveals what user segments are prone to churn, what your power users are, what bug or another issue prompted users to quit, etc.
In a nutshell, retention analysis enables you to identify:
- Most valuable customers
- Ways to increase customer lifetime value and product retention
- User segments at a high risk of churning to timely offer help
- Friction points in the customer journey

5 questions that product management analytics should answer
Product management analytics data is useless by itself unless it is linked to questions/problems we want to address.
Here are a few common examples of such questions a product manager may think about to gain value from product analytics.
- What are the friction points during onboarding? If funnel or cohort analysis showed us that we’re losing customers at the top of the funnel, we must take action and examine what went wrong. For instance, we can use screen recordings to observe how customers interact with the onboarding flow and what they find frustrating.
- Why is the activation rate so low? This may indicate that your onboarding process is too complicated or overwhelming. Instead, try to implement an interactive walkthrough using Userpilot.
- Which features should we add to improve product engagement? There’s no better way to answer this question than ask your customers directly. To do this, employ customer satisfaction surveys, exit surveys, and others.
- Why are certain features sticker than others? Again, you should ask a particular user cohort what they like about those features. You can either conduct customer interviews or collect feedback with Userpilot’s code-free in-app surveys.
- Why most freemium users don’t upgrade their accounts? Probably, the clue is hidden in an insufficient onboarding flow or product friction points. Run funnel analysis to spot what step causes drop-offs.
Best product management analytics tools
So how will we manage to collect all the data mentioned? Does Google Analytics show those metrics?
No, it doesn’t. That’s why we should either code such filters or implement other available product management analytics tools in the market. Sure thing, we opt for the latter because it’s a cost-effective and quick solution.
So let’s look at the main features of the three best product analytics tools.
Userpilot
Userpilot is a versatile product management analytics tool that allows you to carry out customer behavioral segmentation, A/B-test different segments and product experiences, create onboarding flows, or detect friction points across the product.
In turn, feature tagging sheds light on feature engagement inside your app. You can gauge how often and what cohort of users engage with particular features across your product or what features they disliked.

Once you set up Feature tagging, the data will start automatically coming into the report.

Mixpanel
Unlike Google Analytics, Mixpanel allows its users to analyze both your site and your product. Thus, you can dig deeper and track each step of how users progress through the customer journey from different traffic sources (e.g., social media and organic traffic).
It’s also worth noting that Mixpanel reporting is very user-friendly and easy to use.

Amplitude
Amplitude provides product managers with critical data to answer the following questions:
- How do users navigate through your product?
- Which features are they engaging with the most?
- How can you improve user retention?
It also has handy dashboards that are easy to grasp for beginners in product analytics.

Conclusion
Product analytics is a complex topic that every product manager should understand. Otherwise, they will not be able to make informed decisions about product improvements, thus endangering the product’s growth.
Want to collect data about product management analytics? Get a Userpilot Demo and see what valuable insights you can gain to skyrocket your product growth!
The post How To Collect Data for Product Management Analytics and Act on It? [Best Tools Included] appeared first on Thoughts about Product Adoption, User Onboarding and Good UX | Userpilot Blog.
![the-state-of-consumer-trends-[data-from-1000+-consumers]](https://prodsens.live/wp-content/uploads/2022/08/2409-the-state-of-consumer-trends-data-from-1000-consumers-110x110.jpg-23keepprotocol)