Search engine optimization (SEO) has evolved so much in the past few years that many of the key performance indicators (KPIs) traditionally used to identify organic search success need to be replaced.
That’s because tracking clicks and click-based metrics isn’t enough to keep up with contemporary search trends and user behaviors. The rapid increase in the number of competing features in the search results, expansion of voice search, and introduction of AI Overviews and other AI-generated search results has created a need for new KPIs. Metrics that go beyond measuring simple rankings, clicks, and traffic to providing greater insights into brand visibility, user engagement, and goal completion.
To put it another way:
SEO KPIs are dead — long live SEO KPIs!
Okay, that’s a little overstated. The old standard SEO KPIs are only mostly dead.
The SEO toolkit you know, plus the AI visibility data you need.

In this guide, we’ll take a look at how some traditional SEO metrics are still useful, what new metrics we can add that go beyond click data, and what tools are available to track our increasingly complex list of metrics.
Traditional SEO KPIs: A recap
Old-school SEO metrics must be updated with new measures of success. Traditional SEO KPIs aren’t completely obsolete, but many no longer provide a sufficiently complete picture of today’s search landscape.
Some of the go-to SEO metrics we’ve relied on in the past include:
- Keyword rankings: Chasing the top spot for a given keyword was once the be-all, end-all of search metrics. However, as Knowledge Panels, People Also Ask (PAA), AI Overviews, and other attention-grabbing SERP features have evolved, ranking number one has become less important than gaining visibility in the right places.
- Impressions: The number of times a site appears in organic results was once a decent indicator of online brand exposure. Now, impressions only tell one part of a larger story that also includes visibility within AI-generated responses and SERP features beyond the list of blue links.
- Clicks: Visits from organic listings used to be a reliable way to gauge search performance. With the rise of zero-click search and unlinked mentions in AI results, however, new calculations that take into account changing user behavior must be considered.
- Click-through rate (CTR): How often people clicked search links in traditional search results has long been a function of SEO performance that content owners could influence through things like title tags and meta descriptions. However, AI now provides separate context and rewrites titles, descriptions, and even body content to better answer queries and prompts. This means websites have less control over how their links look and how they entice users to click.
Again, these KPIs aren’t suddenly useless. Many of them can still be used to catch and debug SEO problems, as well as monitor and prevent foreseeable issues.
They may also contribute to newer metrics that provide a more holistic view of performance in AI search.
With that in mind, let’s take a look at the direction in which things are moving.
New SEO KPIs: Why key metrics are changing
Over the last a few years, SEOs have observed how AI changes both search results and user behavior. Those insights, as well as recent leaks on the inner workings of Google’s algorithm, are helping marketers craft better ways to measure the impacts of their efforts.
In a way, AI Overviews are just another step (albeit, a big one) in a changing search landscape that’s sought new metrics for a long time now. For years, SEO professionals have needed to find ways to measure the impact of alternative search and SERP features like:
- Voice search
- Featured snippets
- Knowledge panels
- PAA
- Media and product carousels
- Local packs
AI results have provided the final push to really dig in and find a way to capture the impact of visibility beyond simple measurements of rankings, impressions, and clicks.
Google leaks helped create new SEO metrics
A few notable leaks of Google’s inner workings were directly responsible for a big step toward creating new SEO metrics.
Two of these important events include the release of documents from a Department of Justice (DOJ) antitrust case and a more recent Google API leak.
DOJ monopoly case documents
In 2023, as part of an allegation that Google held a search monopoly, the DOJ released a 2016 presentation titled “Life of a Click.” Cyrus Shepard noted several key takeaways on X.

According to the presentation, the three “pillars” of ranking include:
- Body: What the document says about itself
- Anchors: What the web says about the document
- User interactions: Specific to the search results page, including clicks, attention on a result (such as hovering), carousel swipes, and entering a new query
This list differs a bit from what Google publicly said in 2016. At the time, Search Quality Senior Strategist Andrey Lipattsev stated that the three most important ranking factors were content and links (similar to “Life of a Click”), plus the then-new AI model known as RankBrain. This revelation dominated SEO attention and headlines.
It’s possible that there’s a connection between RankBrain and user interactions, but a decade ago it was not clear that interactions other than clicks significantly contributed to rankings. Clicks and related metrics (such as CTR) continue to dominate SEO KPIs, but it’s clear that other interactions need to be factored in for a more complete picture.
Now, we understand that Google uses a variety of user interactions in deciding what content and websites deserve visibility.
API endpoint exploit leak
In 2024, an exploit of endpoint data discovered by Mark Williams-Cook revealed new insights about how Google ranks content:
- Consensus scoring: Content passages receive a score compared to the “general consensus” of their topic.
- Query classification: All queries end up in one of a handful of broad categories with their own ranking factors. Categories include Bool (i.e., yes/no or true/false questions), Comparison, Consequence, Definition, Instruction, Reason, Short Fact, and Other.
- Site quality scores: At the subdomain level, websites receive sitewide scores based on brand search visibility, user interactions, and off-page anchor text relevance. Sites with low quality scores may not qualify for certain SERP features, such as featured snippets and PAA.
- Click probability: Rather than looking at clicks and CTR, Google estimates the likelihood that a user will click on a particular link and adjusts its rankings accordingly.
Understanding how Google looks at these different factors is helpful for understanding new behaviors behind AI-driven search.
For example:
- Consensus scoring may provide insight into how to balance uniqueness for Query Deserves Freshness models against being so contrarian as to run afoul of fact-checking measures.
- Query classification offers a qualitative measure for refining search intent beyond traditional marketing funnel categories (informational, transactional, etc.).
- Site quality scores suggest that as much attention should be paid to influenceable SERP engagement features — such as title tags, meta descriptions, images, and ratings — as backlinks.
- Click probability likewise indicates that focusing on how specific audiences perceive your site and brand will impact your ability to appear in search listings and features.
These insights can lead to the development of KPIs that do a better job of evaluating behaviors that drive actual results. Keep reading to see what some of these metrics are.
SERP feature ownership
Capturing SERP features is the best way to stand out in a search landscape that has undergone continental drift for many years now.

The days of simple “10 blue links” results pages are long gone. The links are still there, of course — but there is a lot more to the SERPs than just links these days.
Nowadays search results are peppered with SERP features like:
- AI Overviews
- AI Mode
- Knowledge panels
- Featured snippets
- People Also Ask
- Review snippets
- Pricing snippets
- Local packs
- Media carousels
- Event details
Furthermore, individual text listings are no longer a simple blue link with a snippet. The implementation of certain HTML, structured data, or other content (e.g., clear publish dates) allows rich SERP features within text listings, including:
- Site links
- Breadcrumbs
- Images
- Byline dates
- Favicons (i.e., site icons)
- Ratings

Getting as much visibility as possible in SERP features and text listings is likely to improve your overall performance. In order to do that, it’s important to have metrics beyond simple rankings and impressions that can help you track SERP feature visibility and identify opportunities to increase your presence.
AI visibility metrics
The appearance of AI Overviews and other AI-powered search features has prompted a need for new metrics that can provide actionable insights.
Because of this, SEO is quickly gaining new siblings in the form of generative engine optimization (GEO) and answer engine optimization (AEO).
- GEO focuses on improving visibility within generative AI responses.
- AEO attempts to provide answers to direct questions in AI-generated answers.
Obviously, there’s a lot of overlap here. Google has always considered searches as questions, even when not in question form — hence use of the term “query” to describe the search text users submit. So, at least for now, generative AI responses are effectively also AI-generated answers.
While the distinction between GEO and AEO may become more significant in the future, for present purposes, we’ll look at why and how to measure visibility for both.
Why track AI visibility?
AI search traffic increased by 527% in 2025 over the previous year.
And it’s expected to surpass traditional search traffic by 2028, according to Semrush.

There’s no clearer signal that tracking AI visibility is important.
IS. Not will be.
The dramatic rise in AI search traffic doesn’t mean that measuring organic results is no longer important. But it does mean that the old metrics aren’t enough on their own to understand how users are finding your website (or not) via AI-generated results.
Here are some metrics you can use to get started.
What AI visibility metrics should you track?
In general, AI visibility metrics fall into three categories: Presence, Appearance, and Analytics.

- Presence: How often are you showing up?
- Appearance: What do the mentions look like, and how do they represent your brand?
- Analytics: How often are AI crawlers finding and indexing your content, and which ones are sending traffic?
The specific metrics used to measure AI SEO will likely change over time as user behavior and search engines change. For now, it’s worth exploring how to measure the following KPIs.
Presence
Measurements of your AI presence correspond to KPIs like impressions, rankings, and search share of voice (SOV) in traditional search results. They help you understand the extent of your reach in AI-generated results, and they provide a yardstick for identifying opportunities to expand that reach.
- Mentions: How many times is your brand or website mentioned (with or without links) in prompts across the board? This will offer you an overall sense of your range across AI-generated results.
- Citations: How many times is your website used as a reference to back up information provided by an AI-generated response? This provides a gauge of your brand’s reliability and trustworthiness.
- Position: Is your brand mentioned before other brands, or does it come later in the response? This demonstrates how relevant or useful AI thinks your brand is compared to other brands.
- AI SOV: What percentage of AI responses include your brand versus your main competitors? This gives you a high-level view of how your AI visibility compares to your primary competition.
Appearance
Appearance metrics provide a qualitative understanding of how generative engines align your brand with the prompts users submit.
- Sentiment: Are AI results putting your brand in a positive or negative light? How well do responses align with your brand’s vision, mission, and goals? How you’re seen in AI responses likely reflects attitudes from across the web, which can inform PR and outreach efforts. Sentiment measurements are especially important for managing your reputation, building brand trust, and receiving beneficial reviews.
- Prompt tracking: Which prompts generate mentions of your brand? Are you showing up where you’d expect to, or is AI injecting mentions into responses that don’t make sense? Understanding how AI associates your brand with different topics and entities can help you direct both on- and off-page SEO efforts.
- Passage relevance score: How closely do specific passages align with search queries or prompts? Passage indexing, passage ranking, and the leak of consensus scores from API endpoint data all indicate that content chunking with specific prompts in mind can be an effective way to appear in AI search results.
Pro tip: iPullRank has a free online tool called Relevance Doctor that lets you score your content’s semantic relevance for a specific keyword or prompt.
Analytics
Analyzing your own traffic data is a great way to see if your content is accessible to (and being read by) AI crawlers, as well as whether AI tools are sending visitors to your site.
- Crawl frequency: How often are AI crawlers accessing your site? Keep tabs on your server logs to see which bots visit, how often, and what content they look at. (Google Analytics filters out known bots, so analyzing your own server logs is the best way to get a handle on a real number.)
- Referral traffic sources: Where is AI referral traffic coming from? How does it compare to other channels like ChatGPT, Reddit, and so on? While referrals from generative responses are significantly lower than traditional search traffic, it’s good to know where AI referral traffic is coming from so you can optimize for those platforms and prompts.
- Indexing rate: Is Google adding your pages to its index? A lot of new content doesn’t get indexed these days because Google is reducing duplicate content in SERPs, ignoring sites with low brand authority, or looking for more diversity of content to cover multiple search intents.
Pro tip: If you’re having trouble getting a page indexed, add it to the site’s main navigation, then resubmit in Google Search Console. Find more ways to solve indexing issues in our indexability guide.
User interaction metrics
What users do on your site matters. Engagement can be the difference between appearing in SERP features and remaining invisible to searchers.
Why track user interaction?
Although Google has frequently stated that user interaction isn’t a ranking factor, leaked information and documents from antitrust trials have demonstrated otherwise.
What exactly do those documents say?
In Google’s internal “Life of a Click (user-interaction)” presentation from 2016, the search giant says that user interaction signals are one of the top ranking “pillars.” A quote from slide three places user interaction alongside body copy and backlink anchor text in terms of ranking importance, with a note saying:
“We may use ‘clicks’ as a stand-in for ‘user-interactions’ in some places. User-interactions include clicks, attention on a result, swipes on carousels and entering a new query.”
A list of other specific interactions appears later on slide five, including:
- Reading the document
- Clicks on the page
- Scrolling through the page
- Mouse hovering
- And “…” to show that other user interactions are in play
Unfortunately, the document is heavily redacted, and we may never know how directly these interactions impact ranking. But what we do see suggests that it’s worth keeping track of how users engage with your content.
Another presentation from Google Search’s 2016 Q4 all-hands meeting says that Google algorithms can’t actually understand documents. Instead, they look at how people react to the documents.
“If a document gets a positive reaction, we figure it is good. If the reaction is negative, it is probably bad.” (slide five)
Google goes on to say that it’s important to design user interactions that allow the algorithm to learn from users (slide six). The understanding gleaned from those interactions helps improve user experience down the line.
It might be tempting to dismiss these insights as being nearly a decade old. After all, there have been a lot of algorithm changes in the last ten years, including the introduction of AI Overviews and AI Mode (originally referred to as Search Generative Experience).
However, in 2017 Google released the “Transformer” architecture, which ultimately enabled the explosion of large language models (LLMs), among them OpenAI’s ChatGPT, Anthropic’s Claude, and Google’s own Gemini.
This means that Google was sharing internal information about the importance of user experience even as it was actively developing the technology that now underpins AI-generated results.
So while Google might be able to understand the semantic relationships between topics and entities within content, there’s no doubt that it’s still relying on user interactions to learn about the importance of those things.
What user-engagement metrics should you track?
Marketers already track user-engagement metrics like dwell time, scroll depth, interactive click events, pogo-sticking, and repeat visits. The goal is to better understand user behavior in order to successfully perform conversion rate optimization (CRO).
It’s important to ensure that these KPIs also inform SEO efforts, since we now know that Google considers some level of user interaction in its ranking algorithms.

Here are some examples of metrics you can use to gauge the usefulness of your content and user satisfaction:
- Dwell time: How long are users staying on your page? The longer they remain, the more likely they find the content useful.
- Scroll depth: How far down the page are users reading and scrolling? People tend to scan pages for the information they want. If a user is willing to scroll further down the page, it’s a good indication they think they’ll find what they’re looking for.
- Pogo-sticking: Are a lot of users clicking the back button right away to return to the search results? If so, chances are they quickly realized that the page doesn’t match their search intent. Keep in mind that not all bounces are pogo-sticking — sometimes, people get the answers they need right away and leave the site without looking at more search results. It’s important to distinguish between bounces that satisfy user intent and those that don’t by combining bounces with the other user-engagement metrics listed here.
- On-page interaction events: Where are users clicking on the page? Are they expanding accordions, using jumplinks, applying search filters, scrolling carousels, watching videos, or using calculators and other tools? Knowing which features users engage with most will help you build your content in ways that can guide users to more and better interactions.
- Repeat visits: How often are users returning to your site or page? When people keep coming back, it’s a good indication that they find your content valuable, and that provides insight into how you can build other pages to capture repeat visits.
Brand authority metrics
Brand authority metrics like branded keyword volume, branded anchor text, and branded CTR are still good ways to track your brand’s reputation and sentiment beyond traditional search listings.
Given the prominence of such metrics, it’s likely that many SEOs are already tracking brand authority in some way. If you haven’t been keeping tabs on your brand KPIs, here are some reasons why you might want to start.
Why track brand authority metrics?
Brand authority has long been a consideration for SEO. Its prominence increased with the introduction of E-E-A-T: Experience, Expertise, Authority, and Trust.
And brand authority is growing even more important with AI SEO, where users may use multiple prompts and queries to inform their decisions before ever clicking through to a website.
Google leaks showed that the algorithm calculates a site quality score at a subdomain level (see Google leaks helped create new SEO metrics above). When viewed alongside Google’s aptly named “Site quality score” patent, it appears that the score is based on two key components.
1. Branded keyword volume: This refers to how often people search for a website, along with other search terms associated with that site.
For example, “searchengineland.com” and “Search Engine Land” are branded keywords that refer specifically to this website, while “search engine news” is a non-branded keyword that’s closely associated with the site.
Using branded keyword volume is one way that Google’s patent says a site quality score can be calculated.

2. Branded CTR: Another way that site score may be determined is through the frequency users click through to your website from the search results, regardless of its ranking position or appearance in SERP features.

Analysis of the endpoint API data leak by Mark Williams-Cook indicates that Google uses these two inputs, along with a count of branded anchor text, to determine a site quality score. (The Google patent doesn’t specifically mention anchor text, but we know from other sources that backlink anchor text is an important signal, and it certainly could help inform a site score behind the scenes.)
Furthermore, subdomains whose site quality scores are lower than a certain threshold may not be eligible for certain features. Methods for applying different thresholds are also described in the patent.
For example, a site quality score of less than 0.4 will exclude sites from appearing in PAA and featured snippets. Other thresholds may exist for different SERP features or queries, such as with “Your Money, Your Life” (YMYL) terms.

Based on this, we know that Google is scoring website quality as a way to estimate brand authority and trustworthiness when it comes to search visibility. We also know at least some of the inputs that go into those scores.
Therefore, it’s a good idea to track related metrics that can help you identify your own brand’s authority with regard to both traditional and AI search.
What brand authority metrics should you track?
Tracking both branded keyword volume and branded CTR is important because we know Google is using them in site quality scores, based on patents and leaked details.
Other metrics, like branded mentions and anchor text across the web, can improve off-page signals and contribute to visibility in AI-generated answers.
Here’s a breakdown of specific metrics to keep an eye on:
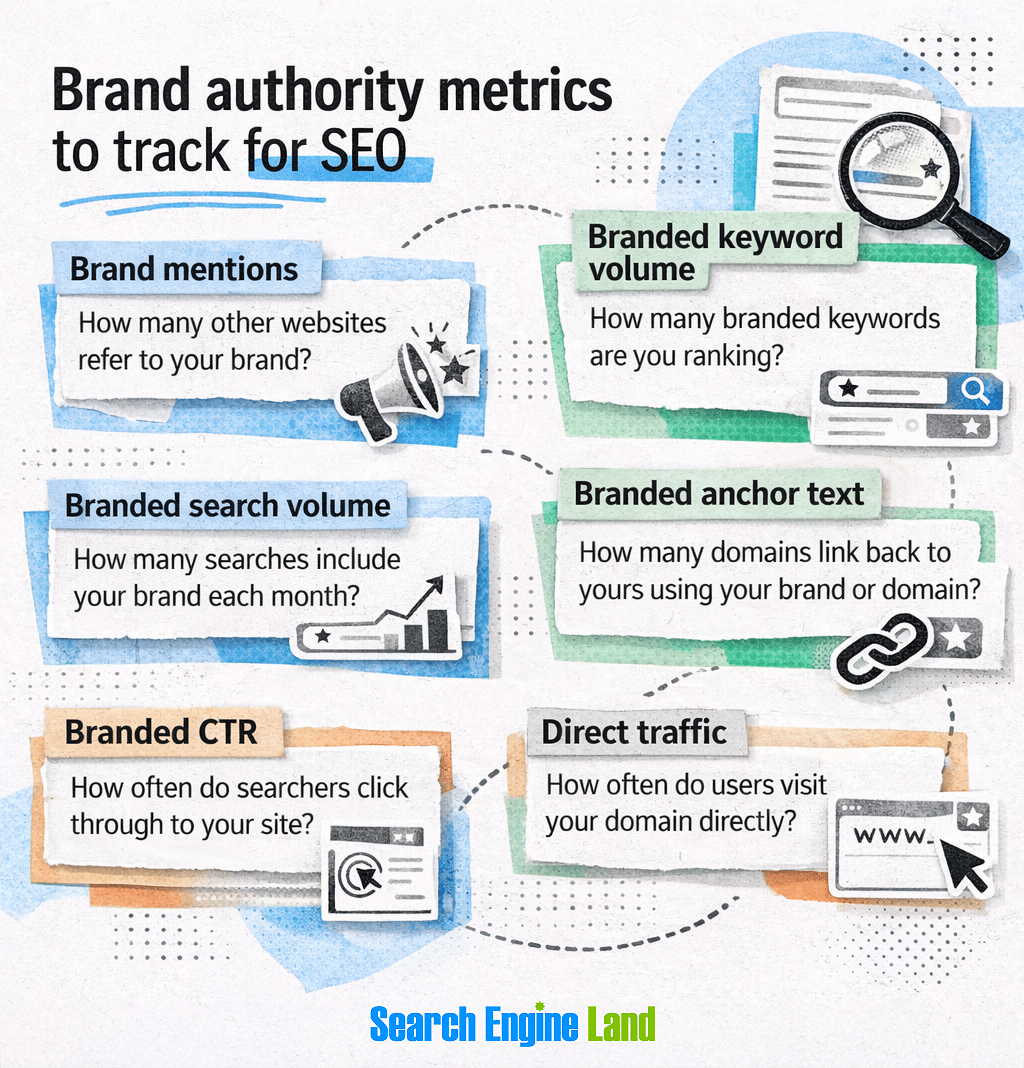
- Brand mentions: How many websites refer to your brand? Past focus emphasized branded backlinks (which are still important), but unlinked brand references in content indexed by search engines and used as training data for LLMs is also a good way to show authority.
- Branded keyword volume: How many branded keywords are you ranking for? As your brand visibility and reputation grows, it should naturally acquire more branded keywords, and the monthly search volume for those keywords should increase.
- Branded anchors: How many domains link to yours using your brand or domain name? Getting branded backlinks is an important part of your overall backlink profile, as they can send positive authority signals.
- Branded CTR: How often do searchers click through to your site? As a component of Google’s site quality score, your branded CTR is critical for understanding how the algorithm may view your site’s authority.
- Direct traffic: How often do users visit your domain directly? Google might not look at this number, but seeing who’s skipping both search and AI to go straight to your site can be a good indicator of how trustworthy your brand is overall.
Dig deeper: Digital PR for SEO: Backlinks, authority, and rankings
Conversion metrics
Conversion starts with search. If you’re waiting for people to hit a landing page before understanding how they convert, then you may be missing out on key opportunities to make sales.
A seamless search-to-conversion process has always required tracking conversion metrics. Here are some things to consider when connecting the two parts of your marketing strategy.
Why track conversion metrics?
By tracking conversion metrics like purchases, form submissions, newsletter signups, and contact requests, you can take advantage of your organic traffic.
In other words, SEO gets people to your site. Conversion is what helps you make money.
A holistic marketing strategy directs traffic from various channels — organic search, pay-per-click (PPC) ads, referral links, and the like — to your website. But simply arriving on your site isn’t the end of the user journey.
Good conversion rate optimization (CRO) guides users toward the next logical step in the process of finding a solution to whatever problem they’re looking to solve. That step might be:
- Making an immediate purchase
- Subscribing to an ongoing service
- Requesting more information about your offerings
- Scheduling a conversation with a representative
These are the conversions that bring in money and directly affect your return on investment (ROI). Nobody wants to spend thousands of dollars on SEO just to get zero sales.
It’s also important to realize that CRO can help you save when customers are looking to resolve problems such as:
- Updating contact or account information
- Receiving support for something they purchased
- Returning or exchanging a product
- Canceling a service
While these activities may not bring in money, they do affect your bottom line.
Approximately 83% of customers believe customer service isn’t as good as it should be, according to Zendesk’s CX Trends 2026 reports. Standing out even a little bit by providing quick resolution to customer service issues will make customers more likely to want to stay with you — and possibly even spend more.
From sales to service, getting people where they want to go relies on tracking the right metrics.
What conversion metrics should you track?
The two most important conversion metrics are the number of conversions and the conversion rate. However, before you start tracking them, you need to know what types of user events should actually count as conversions.
Let’s look at conversion events first.
The specific conversion events you track are going to depend on the things that matter most for your business.
For example, if you’re a retailer or sell directly to consumers, then tracking online purchases is a must. However, if you offer appointments for services or consultations, you’ll need to monitor bookings.
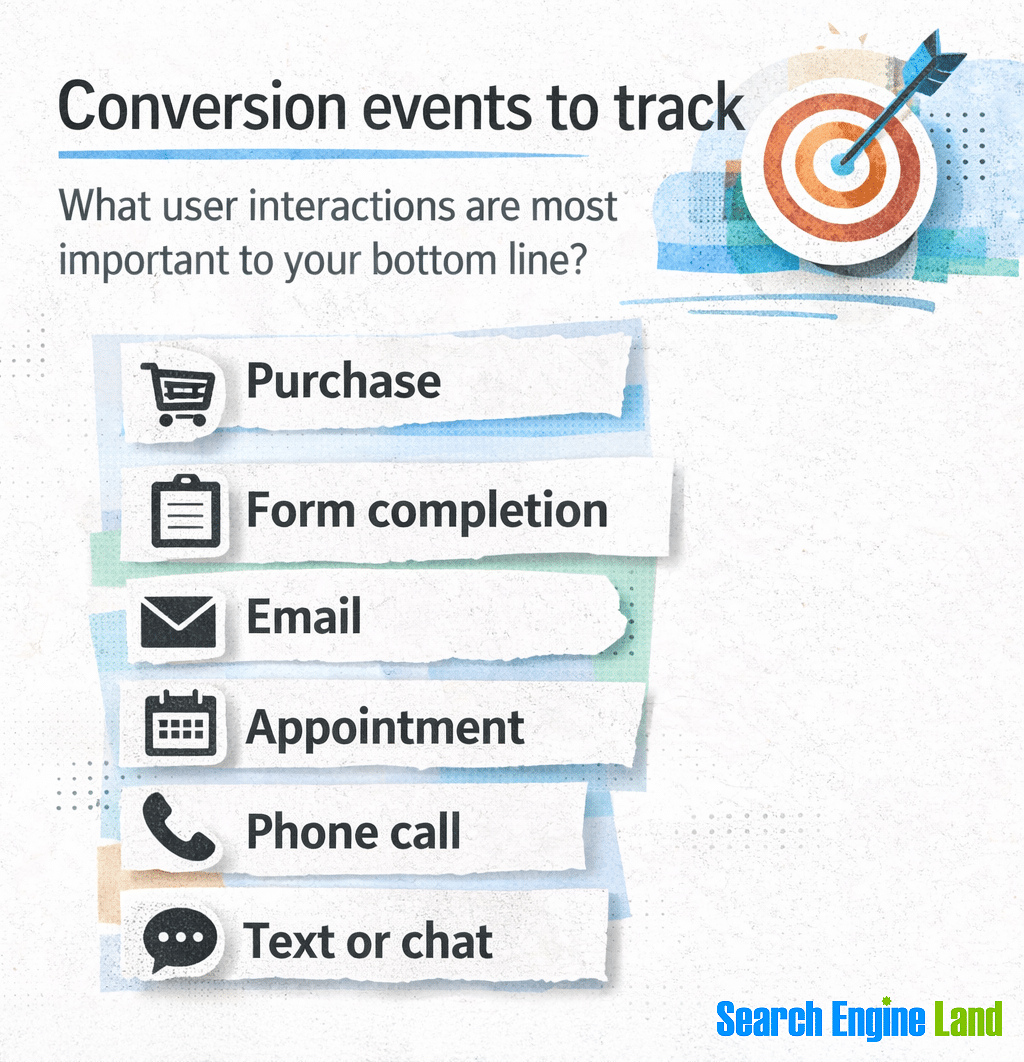
In reality, many businesses will want to track more than one type of user interaction. Here are some of the most common types of conversions you can track:
- Online purchases: What constitutes a purchase can look different from SaaS to ecommerce, B2B to D2C, or other types of businesses. Essentially, this includes any transaction where a person trades money for a product, service, or productized-service — that is, a packaged service offered at a set price (e.g., four blog posts for $400) rather than at an hourly or metered rate.
- Forms: Forms are used for a lot of different purposes, from asking about product features to signing up for a newsletter. Forms provide a structured way of getting prospects into your sales pipeline by triggering a backend action, such as sending an email to the sales team or adding the user directly to your customer relationship management (CRM) database.
- Emails: Separate from forms, user clicks on an email address can indicate interest in learning more about your product offerings. Tracking conversions for individual email addresses, such as a sales email versus a customer service email, can also help you better direct users to the right department.
- Bookings: Scheduling a product demonstration, discovery meeting, reservation, or any other kind of appointment demonstrates a strong interest in your services.
- Phone calls: For users who prefer to discuss things over the phone, tracking phone calls is a good way to make sure you’re meeting them where they’re most comfortable.
- Text (SMS) or chat sessions: Text- and chat-based communication is especially helpful for people who are looking for quick answers and less formal communication.
Once you’ve identified the types of events you want to track, set up tracking for conversion metrics for each event.

As for what conversion metrics to look at, there are two that stand out:
- Conversions (by type): How many conversions are you getting? This is a total number that you can track over a given time period (e.g., daily, weekly, monthly, etc.). This is helpful for spotting patterns such as seasonal trends or reactions to various marketing campaigns. You’ll want to make sure you’re tracking each conversion type (purchase, form completion, etc.) separately.
- Conversion rate: What percentage of total visitors are converting? To get the conversion rate, simply divide conversions by the total number of visitors who arrive on your site. Again, tracking by conversion type will give you insights into where you need to focus in terms of high-ROI optimizations.
Finally, consider tracking assisted conversions. These are conversions where more than one channel is involved in directing the same visitor to convert.
For example:
- A user’s first visit to your website might come through an organic search link in an AI Overview. At this point, they’re in the information-gathering stage, but they’re not yet ready to make a purchase.
- A week later, the same user searches your business name and clicks on the top PPC ad on Google. This time, the user is ready to buy — and they convert.
In this example, SEO assisted in the conversion, but it wasn’t the final touchpoint. Depending on what marking attribution model you use, you may want to consider giving weighted credit to the organic visit, as without it the user might have first found a competitor.
Voice search metrics
Voice search has been around for awhile, and it’s still growing. It’s likely to grow even more as people continue to get more familiar with AI assistants.
The vast majority of voice search occurs on phones, tablets, smart home devices like Amazon Echo or Google Home, and smart TVs. However, voice search is also gaining popularity on smart watches and other wearables, vehicles, and Internet-of-Things (IoT) appliances.
The rise of LLMs like Gemini, ChatGPT, and Perplexity is likely to promote an increase in the use of voice search. As time goes on, AI agents will convert prompts and commands into behind-the-scenes searches as they pull indexed content from around the web and generate a response.
What voice search metrics should you track?
Unfortunately, there aren’t many ways to track voice search directly. However, there are a few ways to identify keywords that have a higher probability of getting used in voice searches.
In particular, voice searches tend to have the following characteristics:
- Long-tail: They tend to be more specific and have longer word count.
- Conversational: They often sound more natural when spoken aloud than typed queries.
- Questions: People often start voice queries with question words like who, when, and how.
- Local: Many voice searches are local, with top industries searched including eateries, grocery stores, food delivery, clothing stores, and lodging, according to BrightLocal.

As far as what to track, a few possibilities include:
- Voice keywords: When pulling keyword data, keep track of those that seem like they’re more likely to have been spoken than typed. Use the characteristics listed above to guide you (e.g., long-tail, conversational, question, and local).
- SERP feature ownership: Identify which SERP features appear for the probable voice keywords, including AI Overviews, AI Mode, knowledge panels, featured snippets, PAA, review snippets, pricing snippets, and local packs. (See SERP feature ownership above.)
- Review mobile segment analytics: In Google Analytics 4, you can filter by mobile devices and operating system (OS) version to get a sense of how many users might be using voice search to find your site.
For this last item, in GA4, click “Reports” > “Tech details” to get to the technical report.
At the top, choose “Add comparison +” to open the list of available comparisons.

Select the checkbox next to “Mobile traffic,” then click the “X” to close the list. If you only want to see mobile traffic, uncheck the box next to “All users.”

Next, scroll down to the table. In the first column, choose “OS with version” from the dropdown box.

This will provide metrics by phone OS version, which can help you hone in on mobile users who are likely using mobile search, at least some of the time.
Tools to measure SEO beyond clicks
There are a lot of tools available to track metrics beyond SEO clicks, and more are being developed as you read this. This section provides some quick hits on tools that can help you measure the KPIs discussed in this guide.
Custom tracking
Google Tag Manager (GTM) is a free tool that works alongside GA4 to let you track an enormous array of user events on your site, among other things.

When it comes to tracking SEO, here are a few of the things you can configure:
- Scroll depth: Set up breakpoints by percentage or pixel to see how far down users scroll. Learn how to do this in the scroll tracking section of our GA4 guide.
- Dwell time: The easiest way to track this metric is to set up one or more timer triggers that fire after a certain amount of time spent on the page. This doesn’t provide a true dwell time, but it lets you identify users who stay for a minimum amount of time.
- User clicks: Select to view the links users click or other elements you want to track — or simply track every click on a page.
Note: For the adventurous (and advanced), there’s also a time-tested way to measure bounce time using GTM and custom JavaScript. Because it interrupts the browser’s built-in history functionality, some people have reported problems with getting it to work, so be forewarned that it might not be reliable in all modern browsers. More importantly, if it stops users from being able to click the “back button” in their browser and return to the SERPs, Google may give you a manual action.
Conversions and goals
Tracking conversions and goals requires analytics tools that can turn visits into insightful and actionable data.
Google Analytics 4 (GA4) provides metrics for traffic of all kinds. It’s one of the most popular analytics platforms, largely because it’s free and easy to integrate with other Google tools, such as Search Console and Tag Manager.
GA4 refers to conversions as “key events.” Any tracked event can be marked as a key event and viewed in engagement reports.
See our guide full of GA4 tips and tutorials to get started tracking SEO metrics.

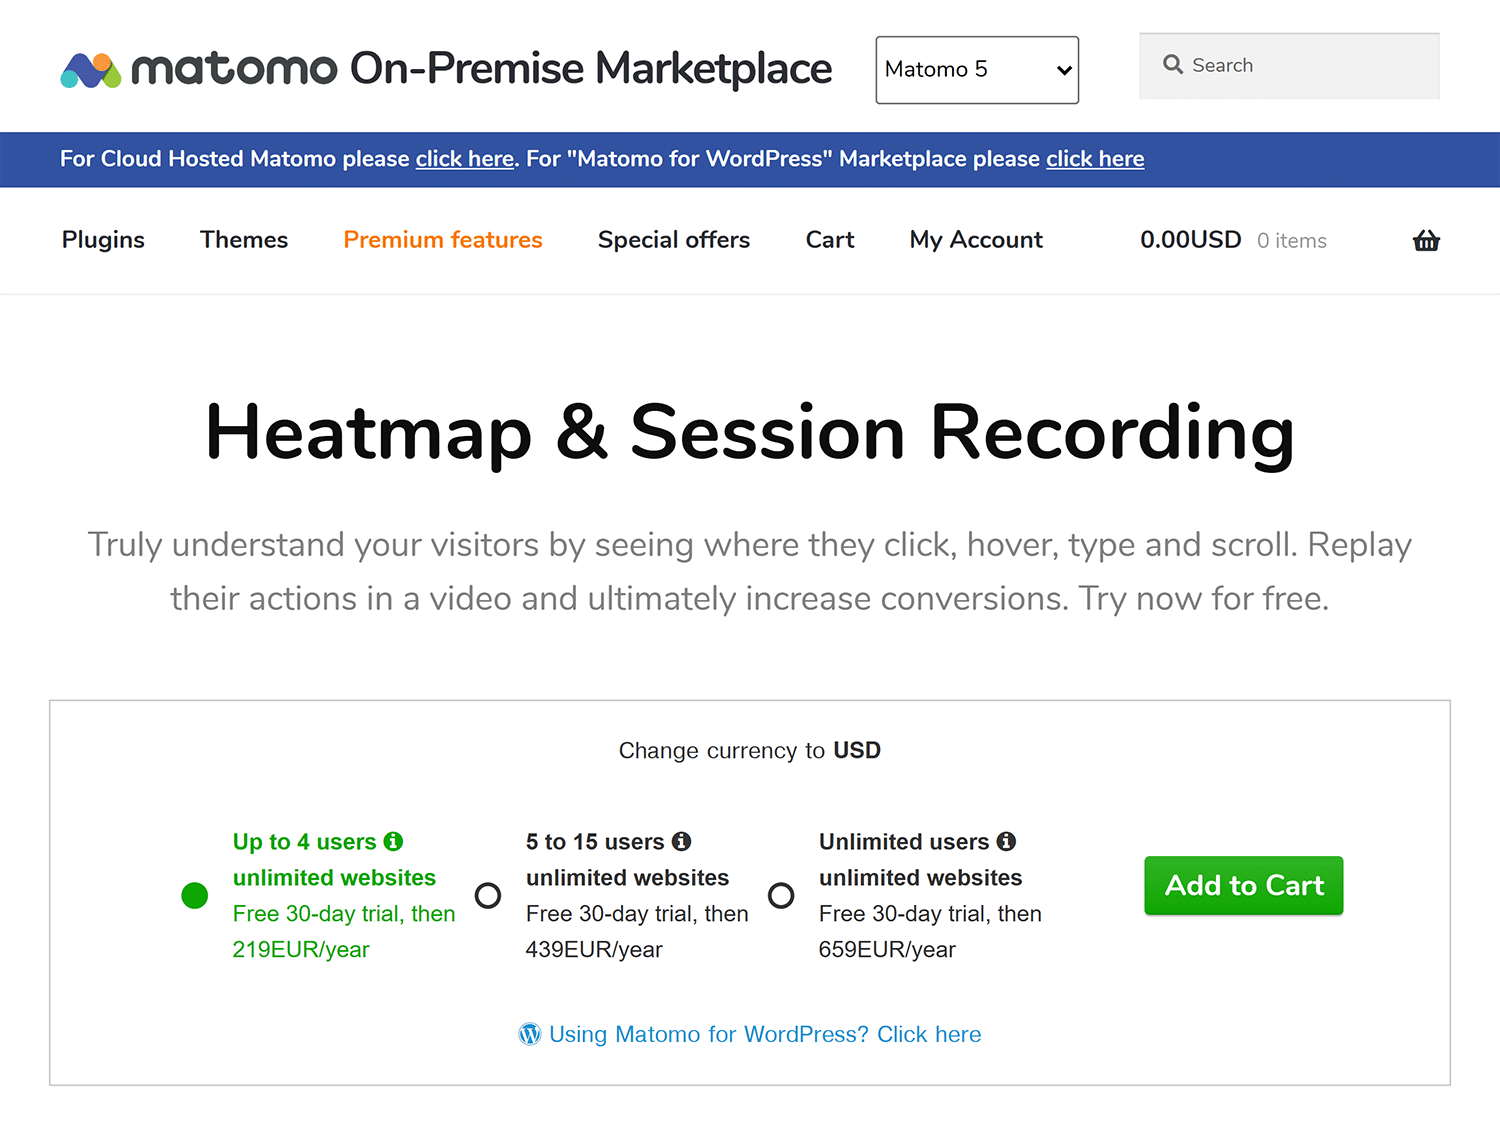
Matomo is an open-source alternative to GA4 that promotes accuracy and privacy. It can be downloaded and used for free, or websites looking for cloud-hosted solutions can pay for a business and enterprise plan.
Conversion and engagement features include establishing funnels and goals, form analytics, and landing page A/B testing.

CallRail focuses on leads from telephone calls, texts (SMS), and forms. It’s a useful addition for sites that want to expand their conversion capabilities beyond web-based goals.
CallRail has the ability to integrate with GA4 and Matomo, along with dozens of other tools, to provide a more holistic view of your conversion metrics.

AI visibility
Tools that measure AI visibility are under heavy development and will continue to be refined as LLMs and other models evolve.
Semrush One includes many of the AI visibility metrics discussed above, including:
- AI share of voice: How often you’re appearing in AI search results compared to your competition
- Mentions: The number of times your brand is brought up across various prompts
- Citations: Instances of your website getting used as a reference for generative answers
- Sentiment: The positive, negative, or neutral nature of brand mentions within AI responses
- Prompt tracking: The specific prompts in which your brand and website appear

Additionally, you can find reputation and brand metrics that impact AI visibility, including brand mentions, branded keyword volume, and branded anchor text from backlinks.
Speaking of brands…
Brand mentions
Monitoring brand mentions across different websites is important for protecting your reputation and building the type of authority that can lead to a ranking boost.
ParseStream tracks keywords in discussions across forums and social media sites, including:
- Hacker News
- Quora
- X (formerly Twitter)
Some of these sites have well-known associations with LLMs, such as Reddit’s $70 million licensing deal with OpenAI and X’s integration with xAI’s Grok. Finding and joining conversations on these sites can potentially provide a big boost to your brand exposure.

Google Alerts may feel (and look) a bit old school at this point, but it’s still a great way to get notified when your brand or website gets mentioned around the web.
Set up alerts for as many terms as you want, then filter them to an email label or folder that you check regularly.

Heatmaps and recordings
Sometimes numbers alone don’t cut it. A visual record of how users engage with your website is a great way to see what’s working and what isn’t.
Matomo, mentioned above (see Conversions and goals), provides both heatmaps and session recordings, in addition to standard website analytics.
Hotjar, which recently joined forces with Contentsquare, focuses on user experience and engagement metrics, including:
- Heatmaps
- Session Replay (recordings)
- Funnel paths
- User surveys
- Customer interviews
- User tests

Crazy Egg is another provider of user-engagement metrics that also offers heatmaps, recordings, user surveys, and A/B testing, among other things.
Another feature of Crazy Egg is error tracking and resolution. This can help debug and fix issues that are affecting SEO metrics all the way down the line from AI visibility to organic results to conversion.

If AI tools can’t see you, neither can their users
Fewer clicks in search results means that the clicks that do happen matter more than ever. It also means that finding new ways to get the attention of searchers is more important now than ever before.
To do that, you need the right tools to give you insights beyond traditional SEO metrics. Try Semrush One now to check your brand’s AI visibility and discover how to get noticed.
Track, optimize, and win in Google and AI search from one platform.