Are you looking for an online tool that offers powerful Gantt chart templates and all the other bits you need for collaboration like file sharing, exporting and resource management? GanttPRO might be just the solution for you.
Read on:
(Full disclosure: I was originally compensated for my time in 2020 preparing this review, but the 2026 update has not be compensated. I am not an affiliate for GanttPRO either.)
General Information
Name: GanttPRO
Vendor: DPM Solutions
Hosting options: Online solution (desktop). The mobile app is available for iOS and Android.
Languages: English, Russian, Spanish, German, Portuguese, and Korean (available on the app)
Cost: There is no free plan (although there is a free trial). Pricing plans cover Core, Advanced and Business with an Enterprise plan. The cheapest plan for 5 members is about $8 per month.
First impressions
The power of GanttPRO is — as you’ve guessed from the name — in the Gantt charting.
First impressions: it’s really good.
I tend to compare things to Microsoft Project because that’s the tool I know the best and have used for years. Having said that, I rate myself as a ‘normal’ user of MSP because I don’t use a lot of the advanced cost tracking features etc.
GanttPRO is Microsoft Project good. I enjoyed using it, and it’s easy. If you’ve used any other Gantt chart project planners, you’ll be able to pick this one up with a teeny learning curve. They also have a free .mpp viewer –useful if you have stakeholders without Project, or are a bit stuck now that Microsoft Project Online is no more.
Creating a Gantt Chart
Create a new project and set the duration you want to work with. The Duration step gives you the option to set hours, days, weeks or months. Then set your working days and hours, so you can give your team a generous lunch break if you like.
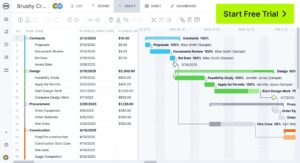
Once that’s done, you see the Gantt chart view.
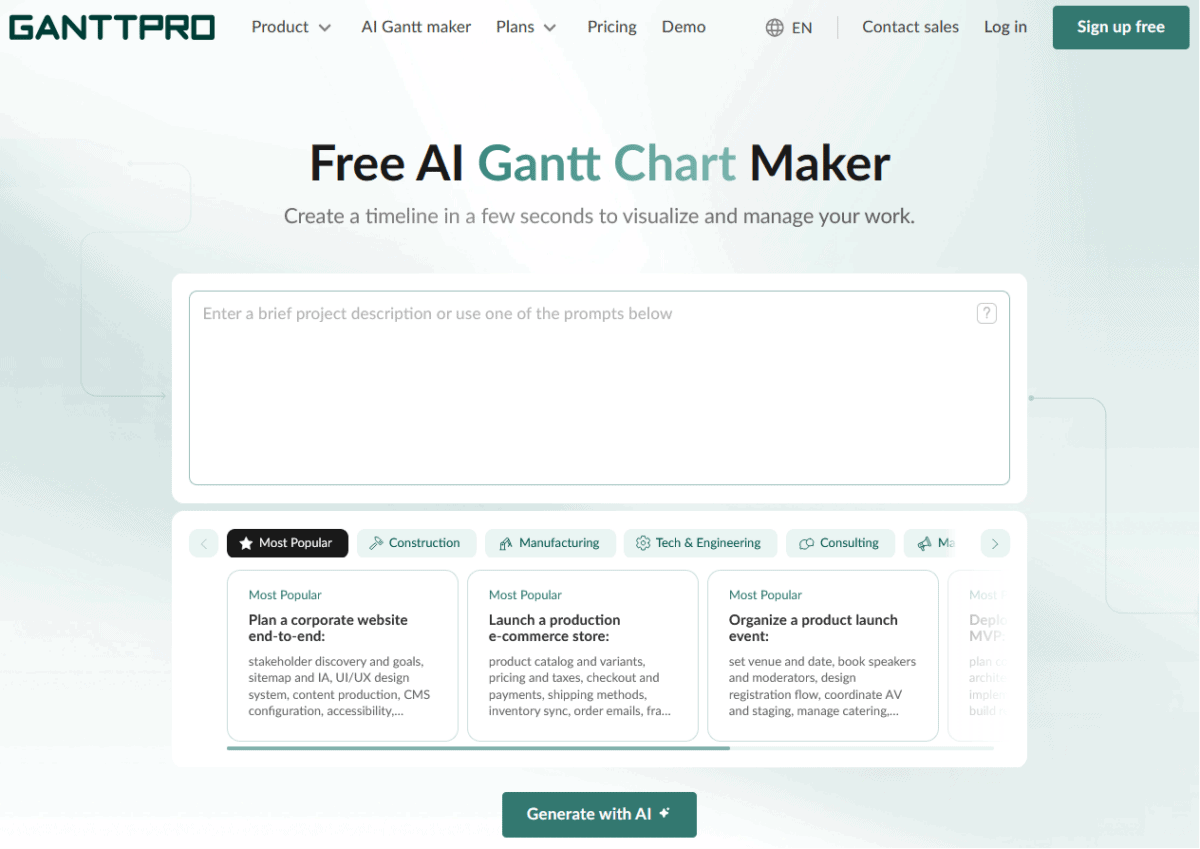
There is also an AI Gantt Chart maker if starting from a blank piece of paper (or screen, these days) is a worry for you. Type in what you want and the Gantt chart magically appears! This reminded me of the functionality in Tom’s Planner, which was the first AI-powered Gantt chart maker I was aware of and still is one of my favorites.
Task hierarchy
The highest level on your project Gantt chart is a sub-project. This could represent a workstream, group of tasks or literally a sub-project, if you are planning a program.
Under that you can add tasks, and the additional ‘three dots’ menu lets you add subtasks infinitely. Click Enter to add another task, or add a sibling task at the same level as where you currently are.
You can drag and drop anything on the Gantt chart even to indent/outdent tasks.
Task icons in GanttPRO
Each task has three icons:
Information: Contains the name and description of the task. You can use the description as a way to communicate key information to other users as you can hover over the task and see that info pop up. Personally, I wouldn’t want to rely on anyone hovering to get any critical information, but I’m sure I could find some use for that field.
Settings: Contains basic task parameters (start/end date, priority, estimate). You can force a deadline of a certain date. That shows you a fire icon on the Gantt chart.
It’s a very visual way of seeing a fixed date. The fire icon doesn’t affect the scheduling — your task can still run late. But as soon as you hit the deadline the Gantt chart shows you a message saying your task is overdue.
I love this feature — what a great way of showing people the impact of late delivery.
The settings icon also gives you
information on dependencies, status (open/closed etc), duration, type
(task/milestones), and task attachments (which you can add from the desktop, drag
and drop, or add from
Delete: If you want to delete the task.
Creating dependencies
It’s easy to create a dependency in GanttPRO. You can do it from the task settings or drag and drop the tasks together on the Gantt chart.
You can set a lag if you need to. And you can use the 4 classic dependency types which is good. I have seen simple tools that don’t allow for lag or some of the dependency types e.g. FF.
Notifications
You can see the notifications you’ve received from the Notification menu and also have the option to email and push notifications (push only show when you are in the tool).
You can tag people in task comments with @ and that flags a notification. You can tailor notifications too — very important if you are trying to manage information overload.
You can set a notification for a fixed deadline as well, to help you get control over the deadline, by sending you an email a few days in advance (or whenever you want to be alerted about the upcoming deadline of doom).
Milestones in GanttPRO
It’s easy to add a milestone in GanttPRO. Choose the option in the list of tasks, or change the type of any existing task.
Change the color of your milestone by clicking on the color box next to the milestone name. I would do this, because the default milestone color is fuchsia, and that’s a bit bright for my stakeholders.
Gantt Chart Columns
The default columns on the Gantt chart are the task name, assignee and status. But you can show any from the long list of
options.
You can sort your tasks by the filters e.g. all the tasks that are Amber can be filtered. And you can save a filter! So you can create custom filters e.g. for showing all milestones at risk for your monthly report.
Resource management
You can invite people via email invitation. As I understand it, you’ll need to set up each project manager as an administrator, as the alternative role (a member) has limited edit rights.
Members can only edit tasks to which they have been assigned, and they can’t change task start and end dates. It’s a limited role. I can’t think of anyone on my teams I’d want to give that to, to be honest.
There’s also the ‘owner’ role which acts as system admin and has access to all projects and billing information.
You can also add virtual resources, which can be:
- A physical resource like a server or a piece of equipment
- A role type like designer or tester
- The name of a person you want to allocate tasks to but you don’t want them to have a login to the software.
Resources can have a cost associated with them (if you want) e.g. price per hour or a fixed cost.
At the bottom of the Gantt chart you can see a workload report.
The resources are listed and you can see their hours scheduled to work per day. Red means overloaded, blue is underloaded and green shows you resources are sufficiently allocated.
You can create personal calendars for resources to allow for holiday time, or part-time members on the team — if you then try to assign people to tasks on those days, the workload report shows in red (it won’t stop you from doing it, though).
Tracking effort and duration
You can do duration and effort-based planning — genius. So task duration can be 1 week but the estimate for effort is 8 hours. The cost column is calculated based on the effort estimate (or fixed cost, if you are using a resource with a fixed cost).
Having said that, I’ve found that there is limited use for this kind of cost tracking on projects. Unless you are enforcing timesheets to track actual hours worked, budget tracking of resource time is fraught with difficulties.
In GanttPRO there is no way to distinguish between billable and non-billable time (you could set up different generic resource types and allocate billable and non-billable tasks to them I guess).
Anyway, those issues with tracking the cost of internal hours are not GanttPRO specific.
Time tracking
You can track hours spent which creates actual cost. There is a timer built in to the app, so you don’t have to be reliant on people tracking their time outside the app and you (or them) copying it in.
Progress is changed manually based on percent complete. That effects the fixed cost of a fixed cost resource. I’m not sure that’s a useful feature for fixed cost resources. Even if the task turns out to be 6 hours and not 8 hours, a fixed cost is the fixed cost. I would say that the cost is incurred as soon as the task is completed.
However, lots of people still track using percent complete so if it’s important to you, the feature is there.
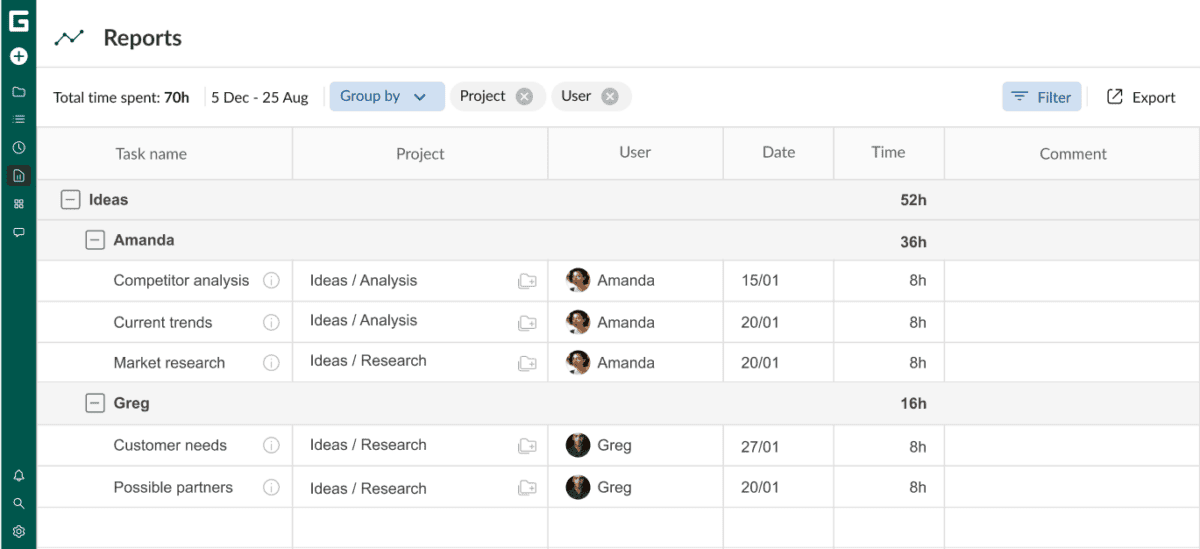
Reports
The reporting function is much improved since I last looked at this product in 2020, but they are only available on business and enterprise plans, which seems a bit limiting to me. You can pull progress, budget or time on task (timesheet-style) reports.
GanttPRO Integrations
You can integrate with Microsoft Teams, Google Drive, Slack, OneDrive, calendars and Jira.
You’ll need an admin to set the integrations up. There is an API if you want to integrate it further.
GanttPRO Billing
There’s a free 14-day trial (no credit card needed) and then you’ll need to sign up for a paid plan.
GanttPRO billing is on an annual basis for individuals, so you are tied into your subscription for the full year. Team plans can be billed monthly as well as annually. It’s very competitively priced, though. And you’ll probably only need paid licenses for your project managers, as many of the people doing tasks can be created as generic resources.
Kanban Board in GanttPRO
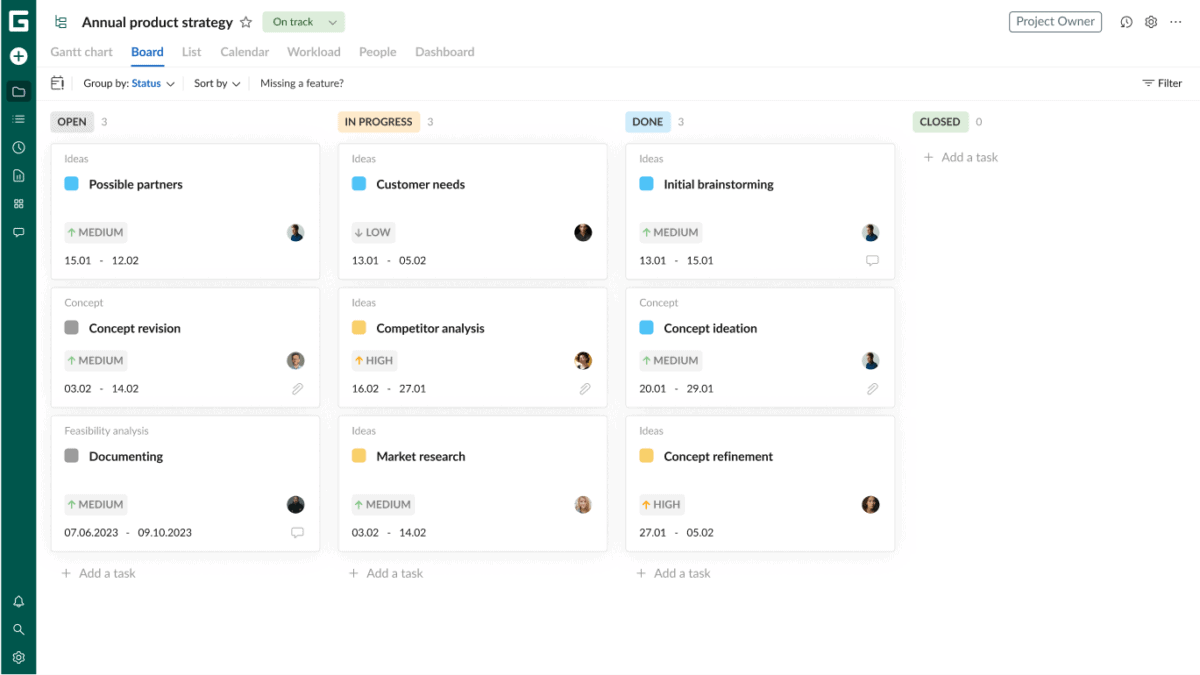
If Gantt View isn’t for you, switch to Board View.
The Board View defaults to Open, In Progress, Done (by the assignee) and Closed (by the PM).
Baselines
You can save as many baselines as you need. Turn on the baseline and you can see the comparison against your current schedule, on the Gantt chart and in the columns (with the original dates/progress etc shown in report).
Sharing your plans with other people
Option 1: Export
You can export as PDF, PNG, XML, and Excel.
You can manage the columns you are going to export so you only get what you need, which is handy.
Option 2: Public URL
If you don’t want to create a document, or your schedule is too large to be put into a document easily, you can share a public URL to your plan for anyone to look at.
You can control the information that is being shared — apply a filter to tailor exactly what you want to show. By default, the URL is dynamic and will show the schedule in real time. That’s great news for stakeholders who don’t want to have to use a different link each time they look at the latest status on the schedule.
If you only want to provide a fixed moment in time view, tick the ‘snapshot’ box to share what the schedule looks like right now.
These link sharing options are great for the CTO or executive who wants evidence there is progress and wants to see the Gantt chart, but you don’t want them to meddle with it!
Save as template
Save the project as a template and then tick to share the template with your team so they can use the template.
Help options
I always like to look at the help options because then you know how much support is available to you if you need to find feature or make something work properly. I was impressed with the customer support available for GanttPRO.
There are links to the Learning Center for YouTube videos etc. Each customer gets an account manager, which is great, and customer support managers are available online for live chat. The online help is good and there were articles available for the things I searched for.
If you want a tool with robust support, GanttPRO fits the bill.
GanttPRO vs Microsoft Project
GanttPRO is a Microsoft Project online alternative. I have already confessed to not being a power user of MSP, but the features I do use in it are all replicated in GanttPRO.
I couldn’t find anything I wanted to do in GanttPRO that I couldn’t, using the standard Gantt chart features out of the box.
In summary
GanttPRO is a solid product for managing individual projects, but wouldn’t be suitable for a team where the PMO needed to see consolidated reporting, unless they were prepared to put this together manually.
GanttPRO is targeted at small and medium businesses that do need fully featured Gantt software but without some of the other ‘agency’ add ins like invoicing. If you care about having the Board View for other purposes or your smaller projects, or personal To Do lists, that’s there too.
The learning curve is small, especially if you have experience using other Gantt chart tools.
I loved the Gantt chart, and it’s refreshing for an online SaaS tool to have such a robust Gantt chart.
This article was first published in 2020 and has been updated in 2026.
This article first appeared on Rebel’s Guide to Project Management and can be read here: GanttPRO Review + Mini Tutorial