Whether you’re outlining a book, building workflows, or brainstorming a customer journey—you’re using a diagram to get it done.
Diagrams are vital resources in presenting information visually and help facilitate clear communication of ideas across teams, departments, and even entire businesses!
We all digest information differently, and with the rise of digital whiteboards, diagramming tools, and flowcharts, more managers understand the need to introduce highly visual software into their tech stacks to support every member’s most productive work style.
Two of the most popular tools in this category? Draw.io and Lucidchart.
But just because they’re two of the most commonly used software doesn’t mean they’re the best on the market or for your team—and you’ve come to the right place to fix that problem!
Follow us as we dive into everything you need to know about Draw.io vs Lucidchart with detailed breakdowns of their top features, use cases, and pricing. Plus, access another customizable and dynamic diagramming software to fill every gap Draw.io and Lucidchart leave open.

What is Draw.io?
Draw.io is a powerful diagram software that helps teams collaborate using diagrams. With its easy-to-use features, users can quickly create professional-looking visuals to support their projects and communications.
Draw.io provides an intuitive interface for designing and creating high-quality diagrams with multiple elements, such as shapes, arrows, tables, text boxes, and images. Additionally, the software includes a wide range of built-in templates to simplify the process of diagramming.
Draw.io makes it easy for teams to work together on complex diagrams by allowing multiple people to collaborate online in real time. With this feature, users can easily add objects to a diagram, edit its content, or add comments and annotations.
All changes are immediately reflected in the shared version of the diagram, so everyone knows exactly what’s going on. 
What is Lucidchart?
Lucidchart is an online diagramming and visualization tool that makes it easy for teams to create and share visual representations of their ideas. With Lucidchart, teams can quickly create professional-looking data charts and cumulative flow diagrams in minutes—no artistic skill or coding necessary.
From flowcharts and network diagrams to org charts and project plans, Lucidchart allows teams to visualize complex information in a way that’s easy to understand. With real-time collaboration features, team members can work together on the same document, creating a streamlined workflow with clarity and direction.
Lucidchart also integrates with popular software such as Jira, Confluence, and Google Apps, making it even easier to use. With Lucidchart, teams can move faster and make better decisions. 
Ready to do some tech talk? Let’s walk through a feature comparison between Draw.io and Lucidchart. What makes them stand apart from one another? Both tools are great options for designing beautiful diagrams. However, their editing tools make them better suited for certain tasks.
Draw.io Vs Lucidchart: Feature Comparison
Using a diagramming tool like Draw.io or Lucidchart is like learning a new language. Both tools offer similar features and benefits, but each has its unique structure. Learning either of these diagramming tools is like mastering any other language: it takes practice and patience, but the rewards are worth it!
Templates
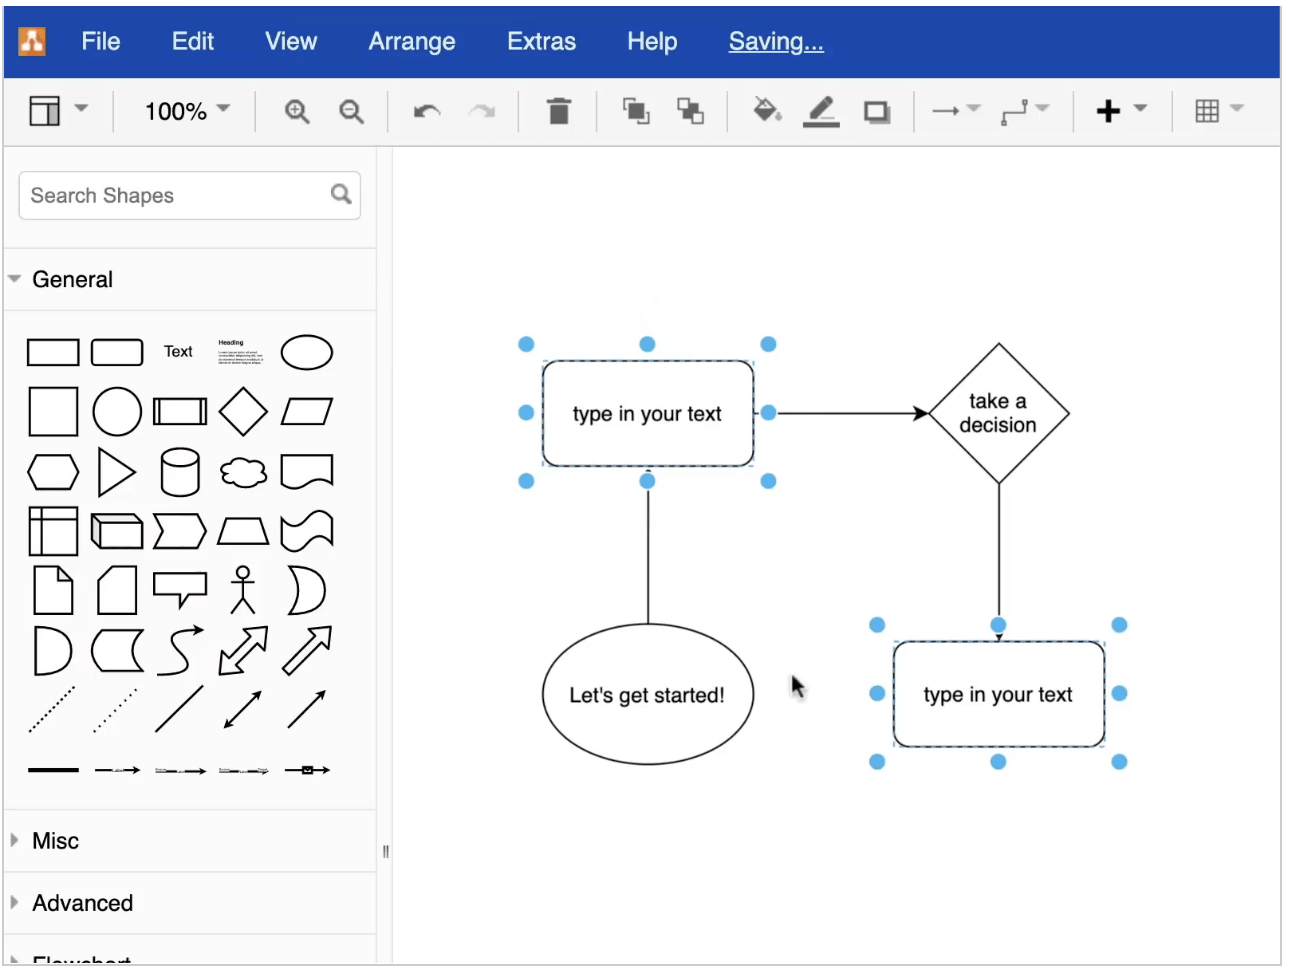
Draw.io is an incredibly powerful tool for creating flowcharts, diagrams, and other kinds of visual content. However, learning the interface can be a challenge because there are so many features and menus to explore. 
For example, when selecting a template in Draw.io, you’ll need to be with the infrastructure you want. If you want to customize the shapes and add text to your diagram, you’ll need to understand how to get the placement correct. Otherwise, you’ll spend too much time arranging all the elements.
On top of this, if you’re working with a complicated diagram and need to quickly insert objects or move elements around, it helps to have knowledge of the elements or shapes, so you don’t have to scroll through the entire menu. 
All these required steps can make Draw.io seem overwhelming for first-time users who don’t have a technical background.

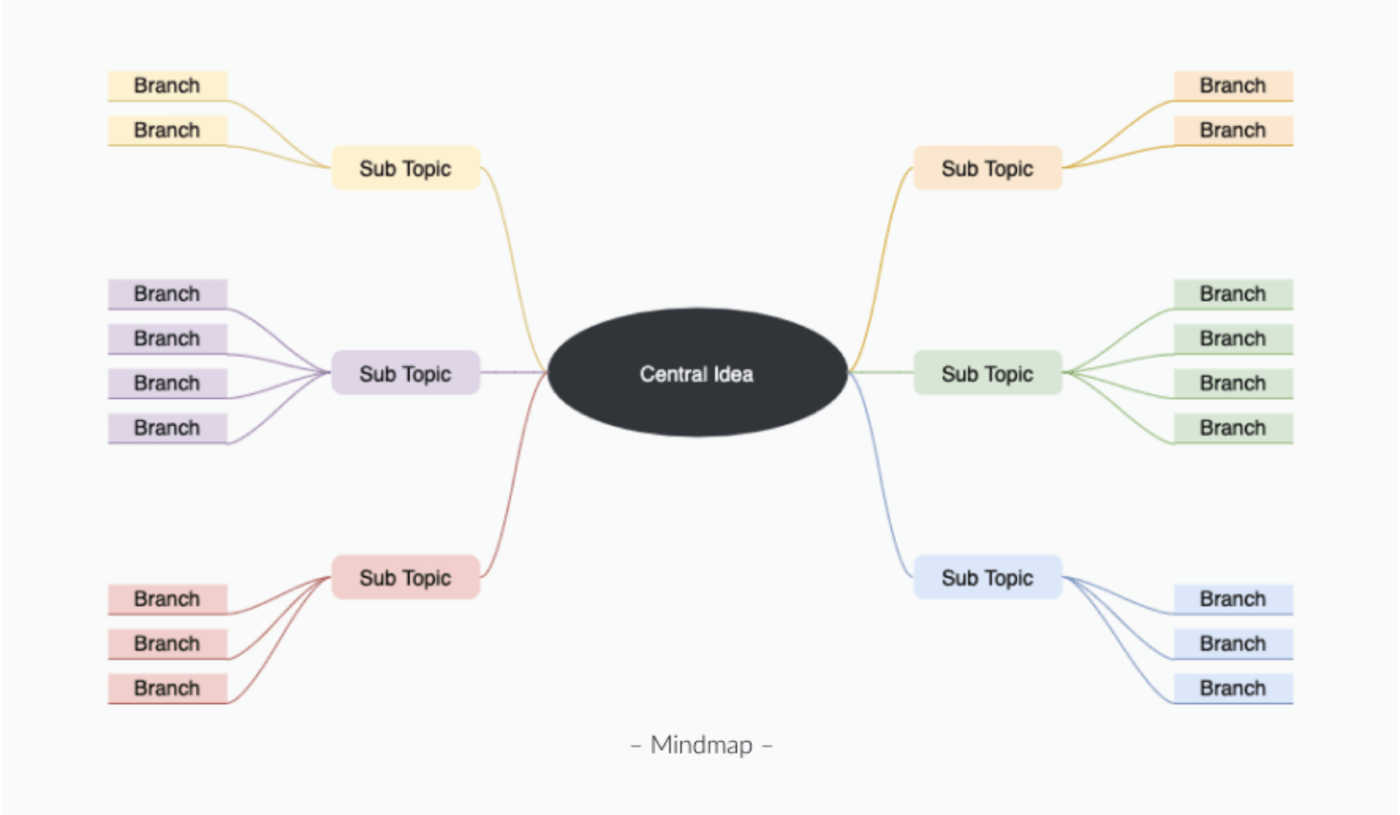
Discover more mind map examples!
Lucidchart is different than Draw.io in that it has a modern, intuitive interface for anyone to pick up and use for brainstorming or planning. Whether you are a designer, marketer, or a student just getting started with visual collaboration tools, Lucidchart makes template customization easier than Draw.io.
Lucidchart’s template gallery organizes hundreds of templates by category. A few categories include Brainstorm Ideas, Fun, Plan, and Increase Sales Efficiency. The collection of templates gives anyone the ability to quickly get started on a diagram without having to worry about choosing color palettes or fonts.

Winner: Lucidchart! 
Lucidchart has a wide range of templates for both personal and work diagrams.
File import and export functions
Draw.io makes it easy to work with different file formats. Its import and export functions let you conveniently transfer the drawings, diagrams, and flowcharts you create from one file format to another. If you need to print a diagram, you can either choose to fit it on one page or multiple.
Here are Draw.io’s available file formats:
| Import Formats | Export Formats |
|---|---|
| .xml (Draw.io) | VSDX (Microsoft Visio) |
| .gliffy (Gliffy) | JPEG |
| .json (Lucidchart) | SVG |
| .vsdx (Microsoft Visio) | |
| .png (with XML) | PNG |
| .jpeg | HTML |
| .svg | XML |
| .csv | URL |
Lucidchart simplifies the ability to work with different file formats. With our easy import and export features, your work is never trapped on one platform or in a single file type. Our cloud-based software allows you to open and save different types of files without worrying about compatibility issues. 
With our handy printing feature, you can choose which pages or layers of your document to print, select the desired page size and orientation, and adjust the content alignment on the page.
Here are Lucidchart’s available file formats:
| Import Formats | Export Formats |
|---|---|
| Microsoft Visio (.vdx, .vsdx, and .vsd) | Microsoft Visio 2010 (VDX) or VSDX |
| OmniGraffle (.graffle, .graffle.zip) | CSV of shape data |
| Gliffy (.gxml, .gliffy) | JPEG |
| Draw.io (.xml) | SVG |
| PNG |
Winner: Player’s choice! 
Depending on which applications you use, Draw.io or Lucidchart offer a variety of formats to transition data from one program to the other.
Editing Tools
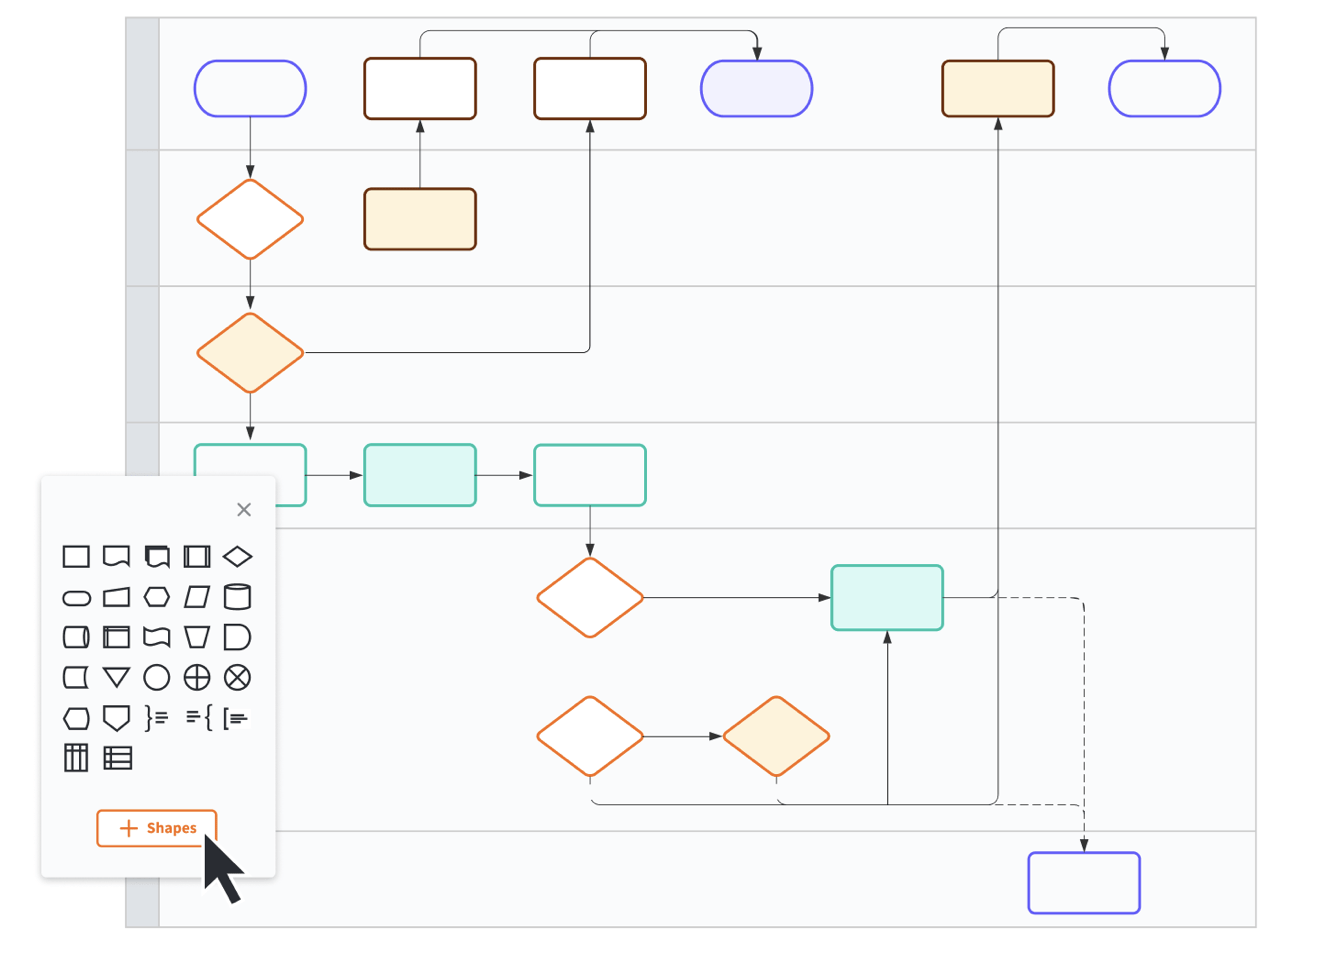
Draw.io’s editing tools offer an intuitive way to create detailed diagrams, flowcharts, and floor plans. With an extensive elements library, you can customize shapes, group elements together, add text, and more. Plus, you can apply colors and styles to your diagrams for added clarity and visual impact. 
The versatility of Draw.io’s editing tools makes it ideal for technical and construction diagramming projects. From basic sketches to complex illustrations, there’s always a shape or line perfect for your diagram!

Lucidchart’s interface and drag-and-drop functionality make creating diagrams straightforward, with the ability to easily resize and manipulate shapes. Teams can also collaborate on the same document in real-time and see working versions of the diagram as they progress! 
Lucidchart has a library of built-in objects like arrows, lines, and charts that teams can quickly use to illustrate their ideas. That way, everyone can visualize the strengths and weaknesses of their organization and take action.
Finally, Lucidchart provides users with detailed analytics about their diagrams so teams can easily track changes over time. This helps them spot trends before they escalate and makes spotting issues easier than ever. With Lucidchart’s editing tools, teams can visualize their processes and make data-driven decisions faster.

Winner: Lucidchart! 
There’s a steep learning curve to understand Draw.io’s menu and features.
Ultimately, Draw.io and Lucidchart are comprehensive diagramming tools that offer value to their users. Draw.io is a great choice for those who need a technical, business-oriented solution, while Lucidchart is ideal for those who require additional functionalities such as live collaboration and an easy interface. Both applications can be used to create visually stunning diagrams!
Draw.io Vs Lucidchart: Pricing and Security
Exploring the pricing plans and security features of Draw.io and Lucidchart can be like a treasure hunt. Both products offer comprehensive tools that are tailored to your needs and budget, with some options offering extra layers of protection and peace of mind. Let’s take a closer look! 
Pricing plans
While Draw.io and Lucidchart both offer free plans that are great for occasional use, upgrading to a paid plan can open up more features tailored to everyday use.
Draw.io pricing
Visit the Atlassian Marketplace for additional pricing details and features. Pricing examples:
- Free version
- Up to 10 users
- Cloud plan
- $15/month for 20 users
- $450/month for 2,000 users
- Data Center plan
- $6,000/month for 500 users
- $10,000/month for 2,000 users
- Server plan
- Contact Draw.io for pricing
Lucidchart pricing
- Free version
- 3 editable Lucidchart documents
- 60 shapes per Lucidchart document
- 100 templates
- Individual plan ($7.95)
- Unlimited editable documents
- Unlimited objects per document
- 1 GB of storage, and more
- Team plan ($9.00/user)
- Password protected publishing
- Commenting
- Revision history with versioning, and more
- Enterprise plan (Contact Lucidchart for pricing)
- Team folders
- Customizable document status
- SAML authentication, and more

Searching for a database solution that offers it all? Look no further than ClickUp! It’s the perfect productivity platform with flexibility, customization, and security—exactly what you need to power your team. 
Meet ClickUp — The Ultimate Diagramming Tool
Both Draw.io and Lucidchart diagrams can help your team integrate visual practices into your everyday project management processes, but you’ll still need to lean on other tools to take your idea over the finish line.
Unless you’re using ClickUp. 
ClickUp is a powerful all-in-one productivity tool with hundreds of flexible, collaborative, and intuitive features to brainstorm, develop, and deliver your projects from one centralized platform. Plus, it’s the only tool that can convert and connect ideas directly to your workflow using features like ClickUp Mind Maps and its built-in digital whiteboard software.
Among ClickUp’s rich set of features, you’ll find more than 15 unique project views to visualize your workload from every angle, including List, Calendar, Gantt, and Kanban-like Board views.
Instant and live detection in ClickUp makes team collaboration easy—and we don’t just mean from its document editor, ClickUp Docs! See when members are typing within a task, updating custom task statuses, adding comments, and more.
And that’s not even half of it!
ClickUp’s diagramming features make your brainstorming sessions more valuable and your next steps even clearer with the help of ClickUp Whiteboards, Mind Maps, and Gantt Chart view—we’ll show you.
Collaborative digital Whiteboards
Imagine capturing new ideas, strategizing their development, and mapping workflows all from the same, infinite canvas—that’s Whiteboards for you. 
Whiteboards in ClickUp were designed to help your team move concepts into action faster, with tools to sketch, add notes, link relevant media, and connect ideas alongside the team using collaborative live editing.
See who’s viewing your board, who’s adding new info, and the instant status of any relevant task, all in a single glance—that’s part of what makes whiteboard project management so efficient.
But what makes ClickUp Whiteboards so unique and so valuable is its ability to turn any shape on your board directly into an actionable task. So you can always stay focused on the end goal in following up on the next steps, even after the meeting has ended.

Plus, ClickUp offers tons of free Whiteboard templates for diagrams, flowcharts, and more! They layer on top of your clean canvas to kickstart any process with the utmost efficiency.
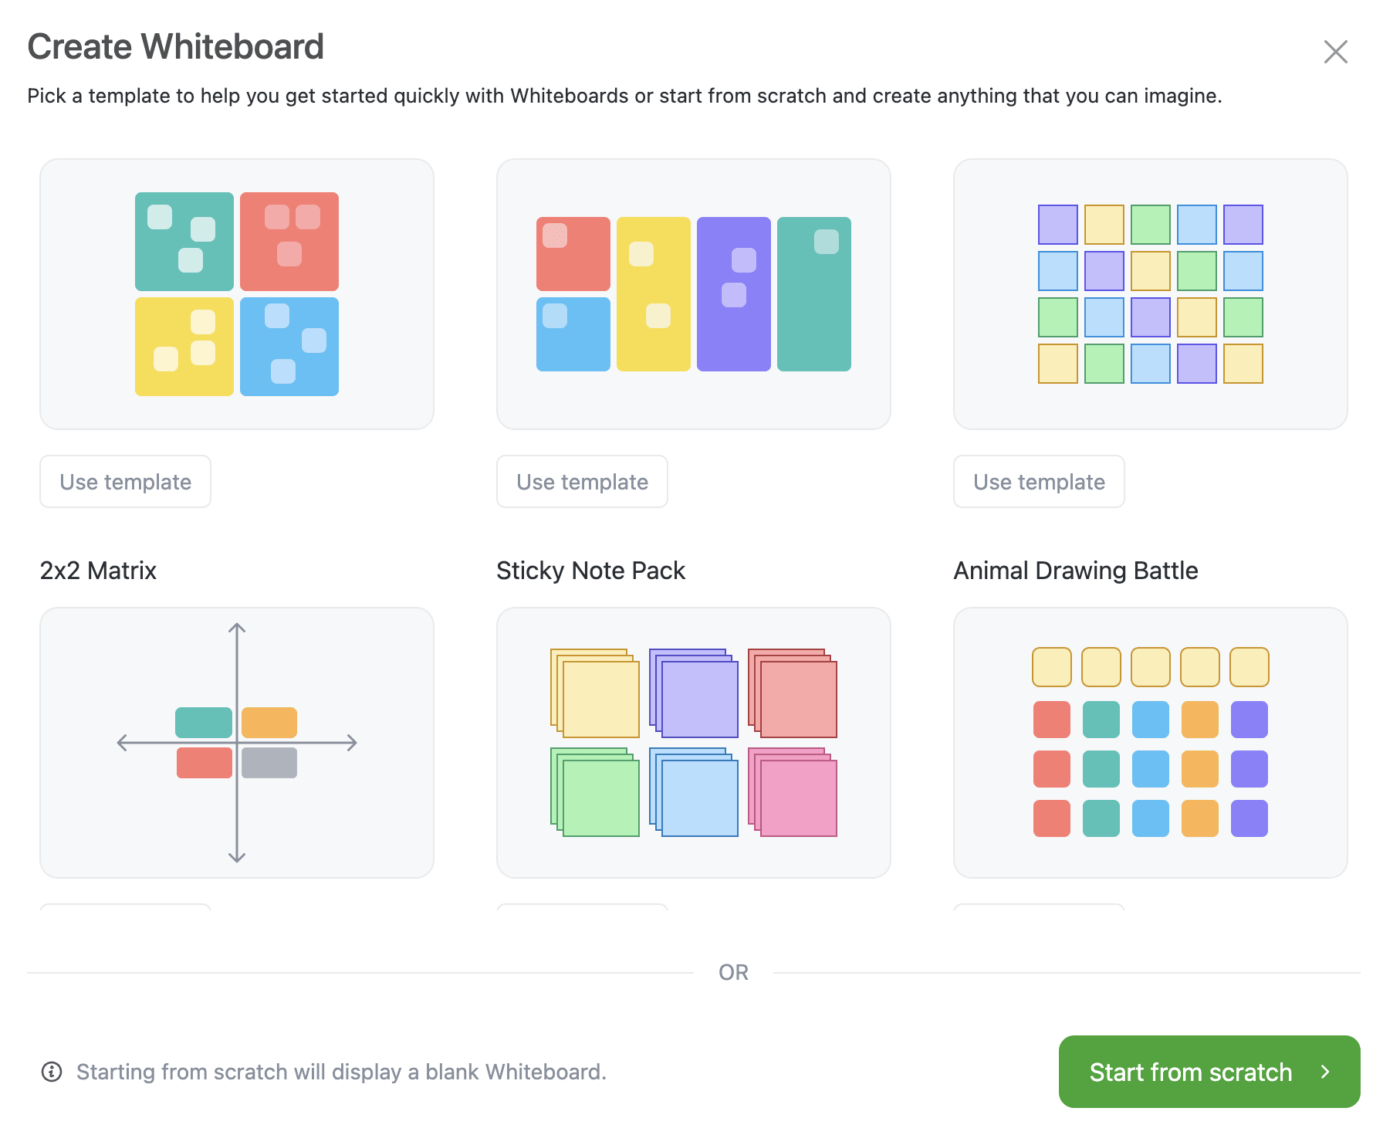
Oh, and did we mention that your first three Whiteboards are completely free in ClickUp? Talk about getting a bang for your buck!
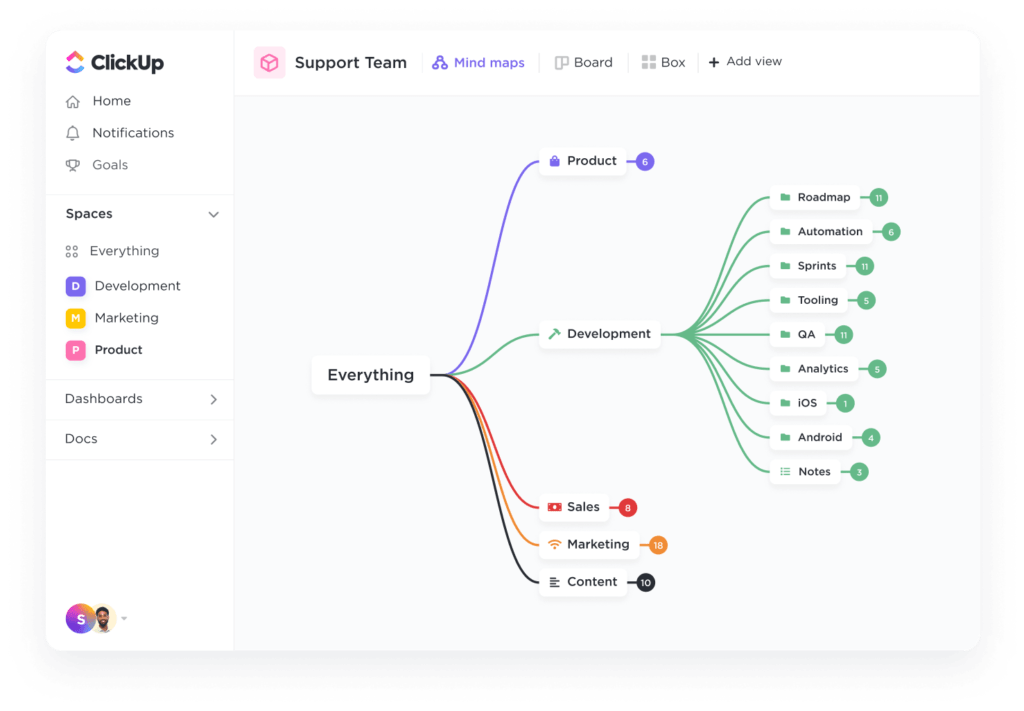
Intuitive Mind Maps
Mind Maps in ClickUp are the solution to organizing every brain dump, idea session, and project into a logical and efficient visual outline.
Break down complex thoughts into a clear step-by-step process or work through different scenarios to reach the same end goal with nodes that convert into ClickUp tasks!
Link tasks directly to your Mind Map or create them on the spot using Task Mode, or have the option to build your free-form diagram from scratch using Blank Mode.

Like in Whiteboards, you can see who’s viewing and contributing to your Mind Map at any time are share your diagram using a simple link.
Check out mind mapping software!
Beautiful Gantt charts
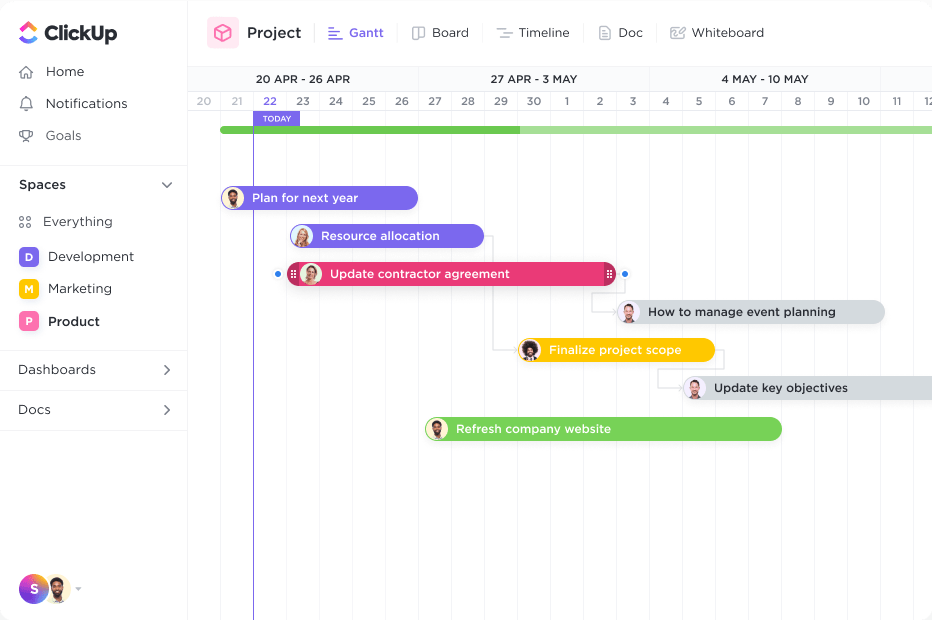
And to top it off, ClickUp’s dynamic Gantt view is the perfect Gantt chart resource for scheduling tasks, managing dependencies, and alighting the team on top priorities using a flexible timeline.
Gantt view makes time management easier and more visual with adjustable timelines designed to help you meet deadlines and avoid bottlenecks every step of the way. Create dependencies by simply drawing a relationship between two tasks, get a high-level view of your overall project status using progress percentages, and so much more, all from one view.
You can even automatically calculate your critical path to visualize key Milestones, and sort action items with color-coded options to know exactly what’s happening within your tasks at any time.
Take Your Diagrams Further With ClickUp
What’s more, ClickUp integrates with over 1,000 other work tools and comes equipped with a vast Template Library for every use case! Including countless pre-made templates for Whiteboards, Mind Maps, and Gantt Chart view to get your work flowing as efficiently as possible!
Ready to see just how powerful your workflow diagrams can be? Access all of these advanced features at absolutely no cost with the Free Forever Plan when you sign up for ClickUp today.
The post Draw.io Vs. Lucidchart: Which Diagram Tool is Better? appeared first on ClickUp.