The first step toward building a viable project schedule is organizing activities. One way to get organized is by using an arrow diagram. This is a tool for visualizing activities throughout the entire project.
What Is an Arrow Diagram in Project Management?
Arrow diagrams are project network charts used in the planning stage of project management to schedule activities, which are represented by arrows, to better meet deadlines and use the right resources at the right time.
There are two main types of arrow diagrams: the activity on arrow diagram (AOA) and the activity on node diagram or precedence diagram. As their names suggest, the main difference between these two approaches is that one uses arrows to represent activities, while the other uses nodes.
Why Are Arrow Diagrams Important?
The arrow diagram is important for the project schedule because it leads to determining the critical path. The critical path represents the longest duration of every dependent task, and it’s used to find the most efficient schedule while still accomplishing the goals needed for a successful project.
Creating a schedule for a project is a way to organize tasks and know not only when they have to be executed, but which ones must be completed and which could be bypassed while still meeting the goals and objectives of the project. This is why an arrow diagram is so important. It leads to the best schedule for the project.
But arrow diagrams do more than just chart the best course from start to finish of a project. They also reveal scheduling and resource problems that might come up and how to resolve them. It can also show where additional resources might move the project faster toward completion!
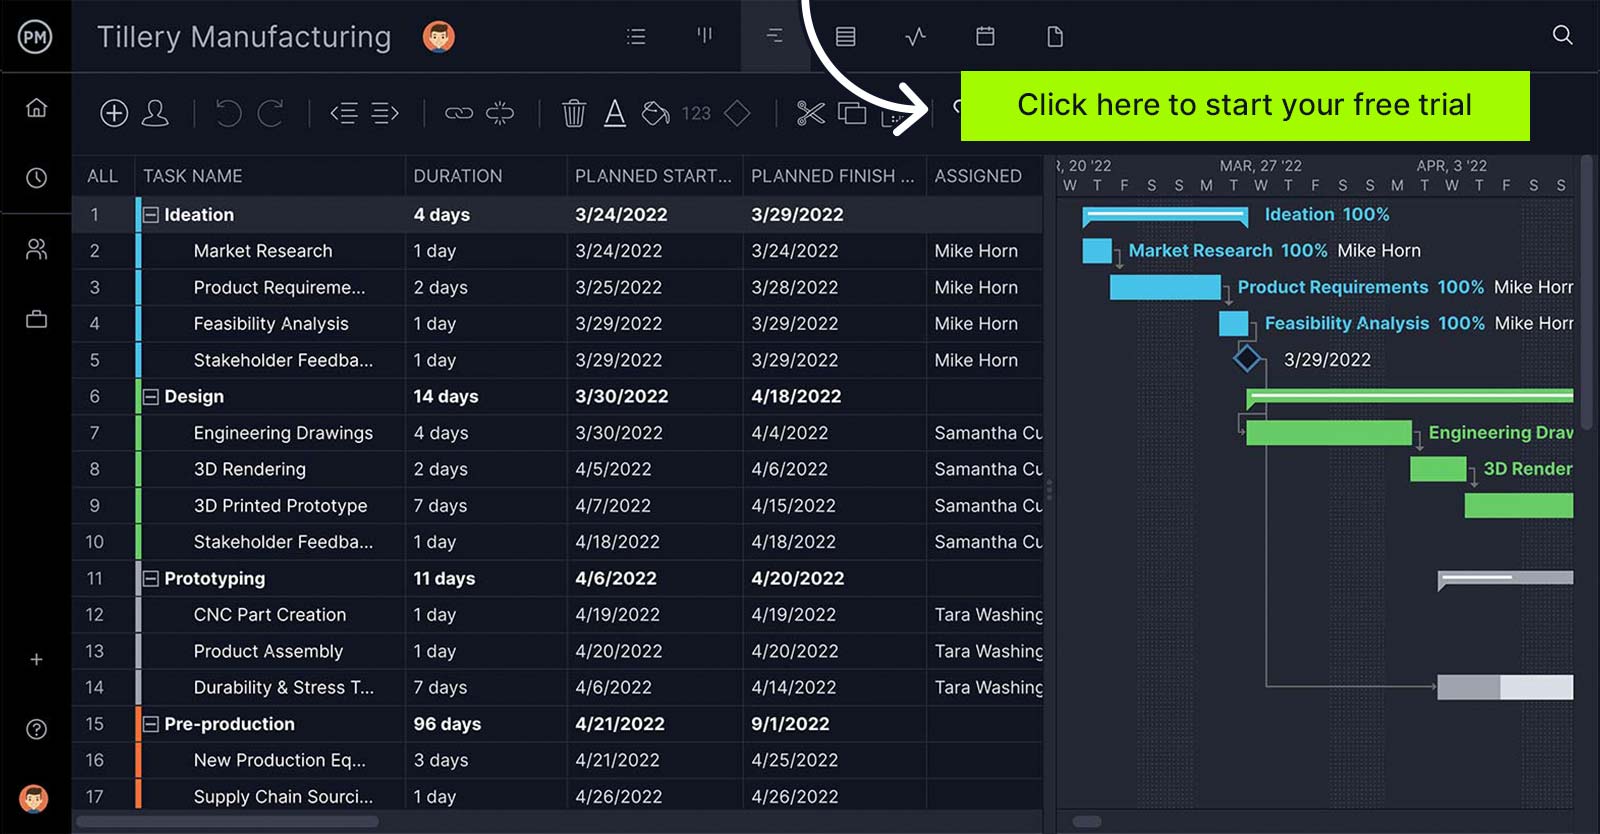
Project management software facilitates the process of making a project schedule, assigning tasks to team members and tracking their progress. For example, ProjectManager’s Gantt chart helps schedule project tasks, identify task dependencies, identify the critical path of a project and much more. Get started with ProjectManager today for free.
When to Use an Arrow Diagram
Using an arrow diagram lays out the steps necessary in a project or progress and the order they need to be executed. It shows the duration of each of those steps. Meeting the deadline is crucial for any project’s success and an arrow diagram assists in meeting those deadlines.
This technique makes it easier to figure out a sequence of events in the project, allowing project managers to drive efficiencies while meeting the timeframe of the project. It is a scheduling tool but also assists when monitoring the progress of a project. It is useful, especially when dealing with complex projects with many interrelated tasks.
Get your free
Critical Path Template
Use this free Critical Path Template for Excel to manage your projects better.
The Different Types of Arrow Diagrams
There are two different types of arrow diagrams: the arrow network (also called activity on arrow (AoA)) and the node network or activity on node (AoN), also known as a precedence diagram.
Activity on Node Diagram
In this type of diagram, the activities are represented by nodes. The nodes are then connected by arrows. These arrows are used to show the relationship between the activities. Unlike the above diagramming, all four types of task dependencies can be shown—finish to start, start to start, finish to finish and start to finish.
Activity on Node Diagram Example
Let’s illustrate this activity on node diagram with a simple project—building a deck for a house. First, create a table of three columns. On the left is the name of the tasks and an ID number or letter, followed by a column listing the immediately preceding activity (IPA) and the final column will show the duration of the task in days or whatever time frame is appropriate. Our deck project would look like this:
![]()
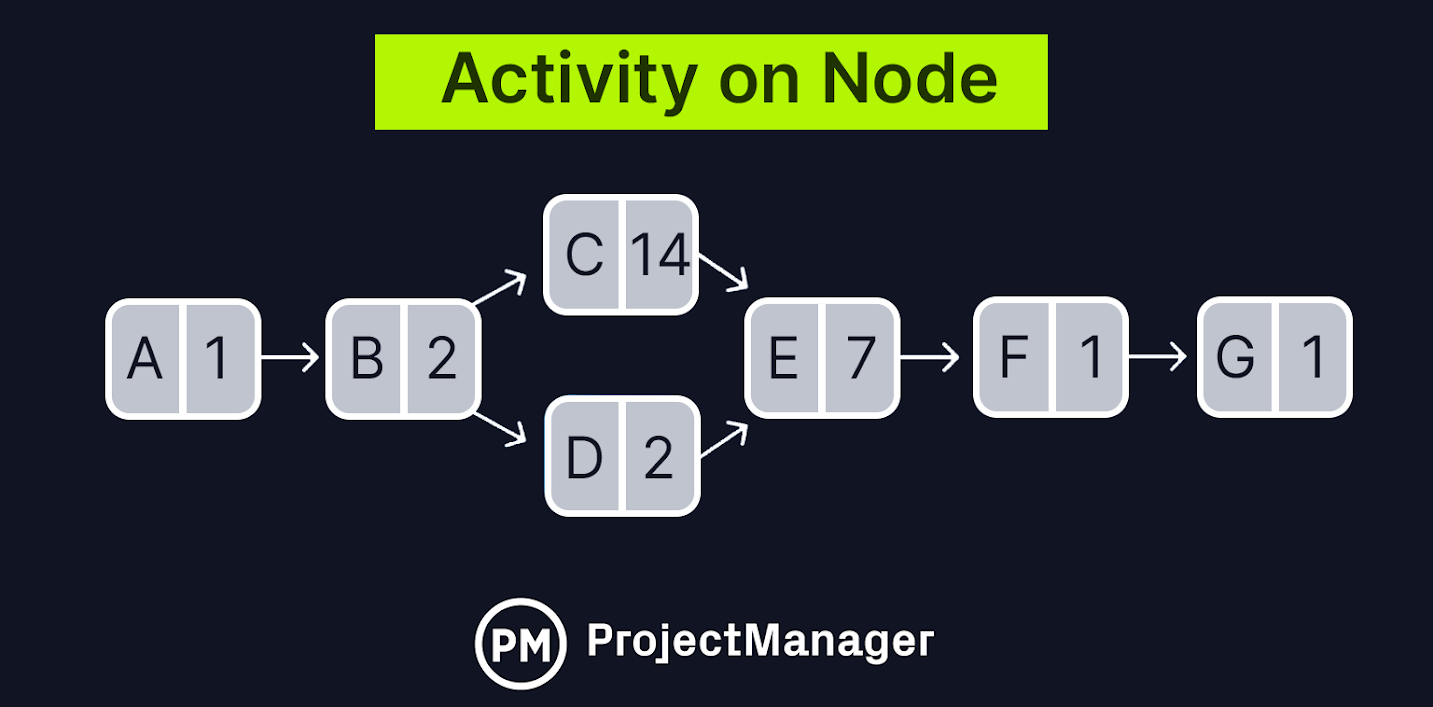
Next, create a box or node broken into two parts. One part has the name of the tasks and the other has the duration. Start on the left with a node with no activity before it. Then add an arrow moving to the right for the next node. If the activities can occur at the same time, such as submitting the permit and purchasing materials, then they are stacked. Therefore, our deck activity on node diagram would look like this:
Activity on Arrow Diagram
This is the diagram we’ve been talking about, one in which the activities are represented by arrows. These arrows are then connected by nodes, with the back of the arrow indicating the start of the activity and the front point at the end. The length of the arrow is the duration of that activity, drawn in scale to fit on the diagram. This type of diagram only shows finish-to-start dependencies between activities.
These activities are connected at points called nodes, represented on the diagram by a circle. These connections indicate the order in which the activities must be done in the project schedule and can be used to identify project milestones. Arrows also show task due dates, duration and dependencies.
Activity on Arrow Diagram Example
We’ll use the same project for the activity on arrow diagram and the same table as illustrated above. The basic concept is the same, but for an activity, the arrows represent activities on the diagram. Otherwise, the construction of this diagram is the same as above and looks like this:
![]()
We’ve established that there are two types of arrow diagrams and how they can be used to depict project timelines, but why do they exist? The main reason there are two types of arrow diagrams is that they’re used for different arrow diagramming methods.
What Is an Arrow Diagramming Method?
An arrow diagramming method is a project planning technique that utilizes arrow diagrams to map the task sequences that make up a project, process or workflow. The two more commonly used arrow diagramming methods are the critical path method (CPM) and the Program evaluation and review technique (PERT).
Critical Path Method (CPM)
The critical path method (CPM) is a project scheduling technique that uses an activity on node arrow diagram to represent the duration, dependencies and execution order of project tasks.
Besides this arrow diagram, this project scheduling approach uses a formula or algorithm to calculate the expected completion time of tasks based on their duration and the duration of their preceding dependent tasks. This formula uses the following values to do so:
- Earliest Start (ES): The soonest a task can start considering the earliest finish of its preceding task.
- Earliest Finish (EF): The earliest a task can be completed, which is obtained by adding its earliest start and estimated duration.
- Latest Start (LS): The latest start date for a task in the event its predecessor takes the longest time to finish.
- Latest Finish (LF): The sum of the latest start of a task and its duration.
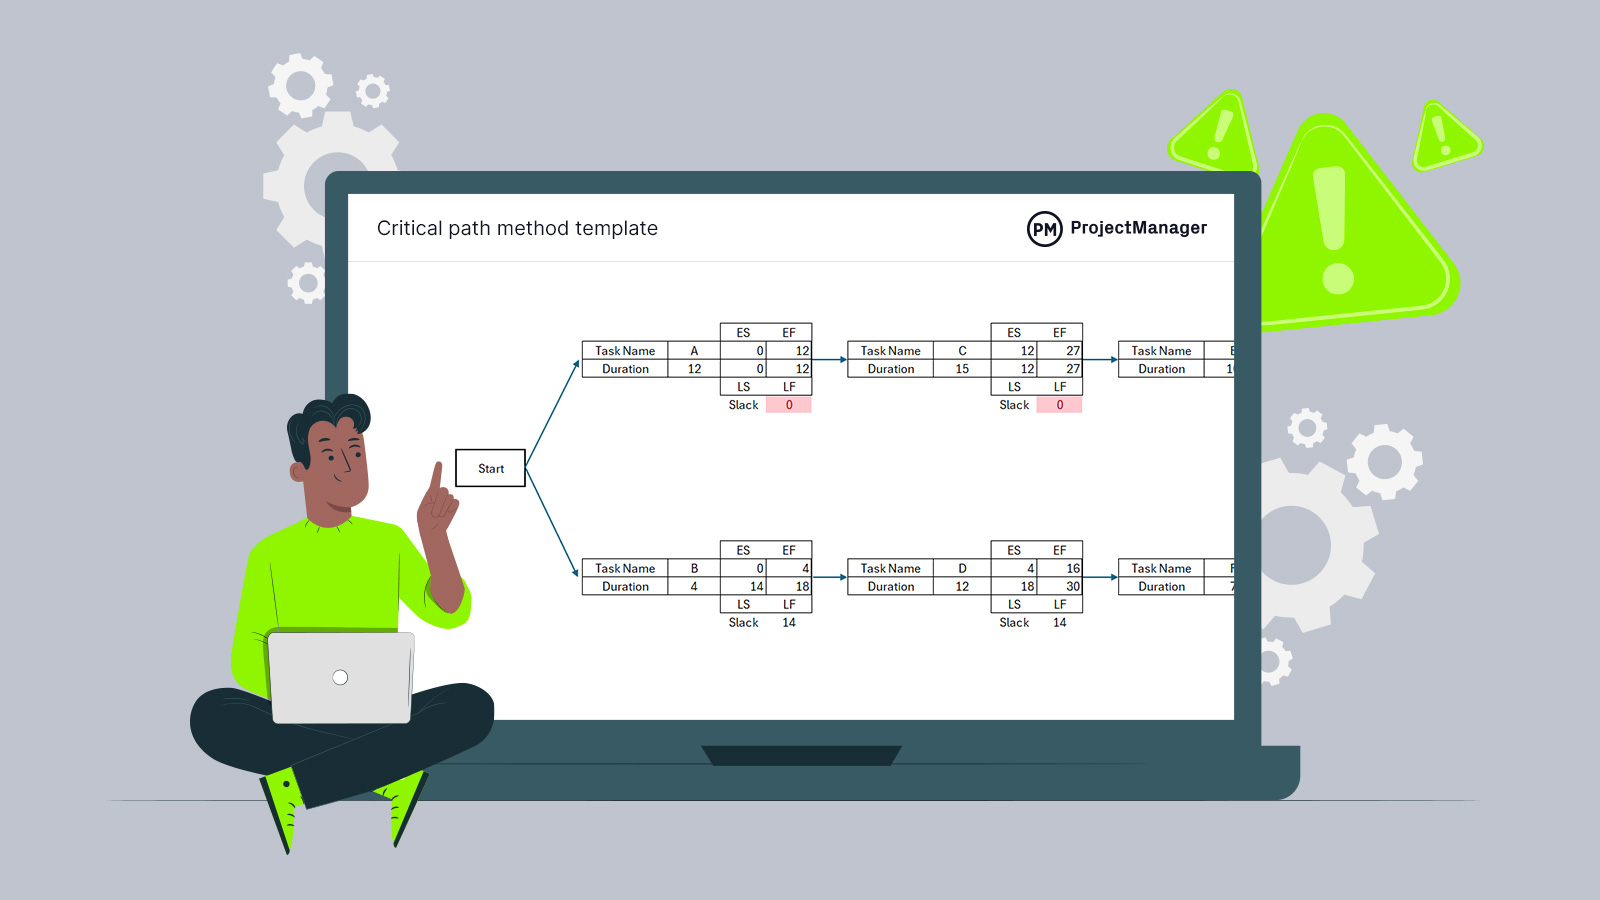
CPM Arrow Diagram Example
The image below shows a CPM arrow diagram. As you can see it’s an activity on node diagram as arrows are used to show the order in which tasks must be completed and dependencies among tasks.
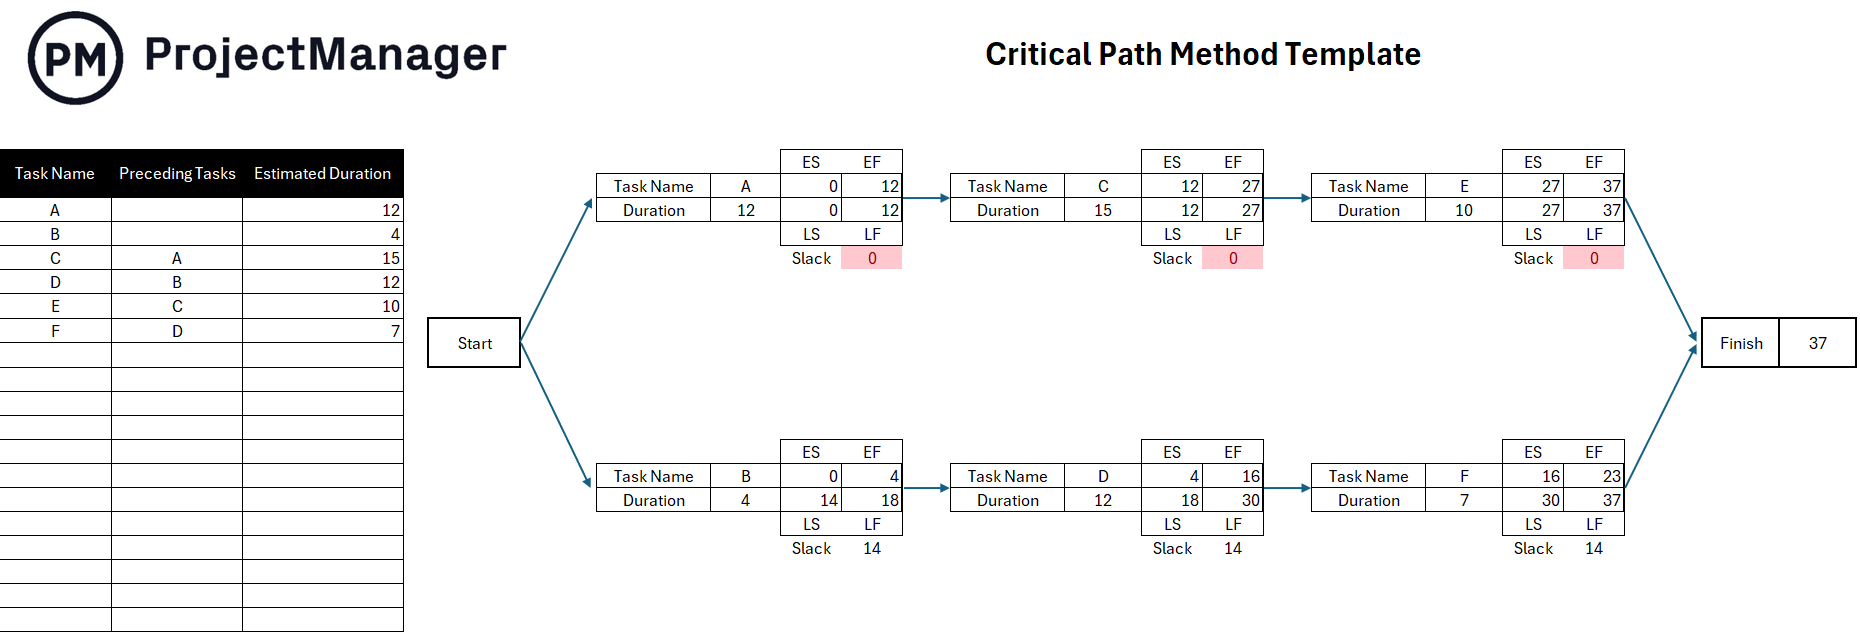
In this arrow diagram example, the nodes aren’t simply circles representing tasks but instead are squares or tables showing the name of each task, its duration and estimated start and finish times, which are calculated by factoring their earliest start (ES), earliest finish (EF), latest start (LS) and latest finish (LF) times.
This activity on node CPM diagram shows two task sequences, A-C-E and B-D-F, which will take 37 and 23 days to complete respectively. Tasks A, C and E are the critical path activities with no slack that mark the total project duration, while tasks B, D and F are non-critical path activities as they have 14 days of slack.
Program Evaluation and Review Technique (PERT)
The program evaluation and review technique (PERT) is a similar technique to CPM, as they both help estimate the total duration of a project and visualize its task sequences. However, this method employs an activity on arrow diagram that uses arrows to depict project tasks, while its nodes show project milestones, deliverables, or simply outcomes for each task.
Like CPM, PERT uses a formula to calculate the duration of each task. In this case, there are three different time estimates for each task. These are established by the project manager and then factored into the PERT formula to determine the most likely time that it will take to complete project tasks.
E=(O + (4*M) + P) / 6
- Optimistic Time (O): The fastest a task can be completed. While this estimated time is optimistic, it must still be realistic in terms of the current resource capacity of the organization.
- Pessimistic Time (P): The longest it will take to complete a task assuming risks occur, and its execution is delayed. In simple terms, anything that can go wrong, does.
- Most Likely Time (M): The most likely time for the completion of a task given the particular conditions of the project. This time can be determined by subject matter opinion or by reviewing past project data.
- Expected or Estimated Time (E): The expected duration of a task after using the PERT formula. This is the value that’s shown in this activity on arrow diagram.
In addition to the main PERT formula, there’s a standard deviation formula that’s used to gauge the level of confidence there is for the most likely time. The larger your results, the less confidence you have in your project time management estimate, and vice versa.
(P-O) / 6
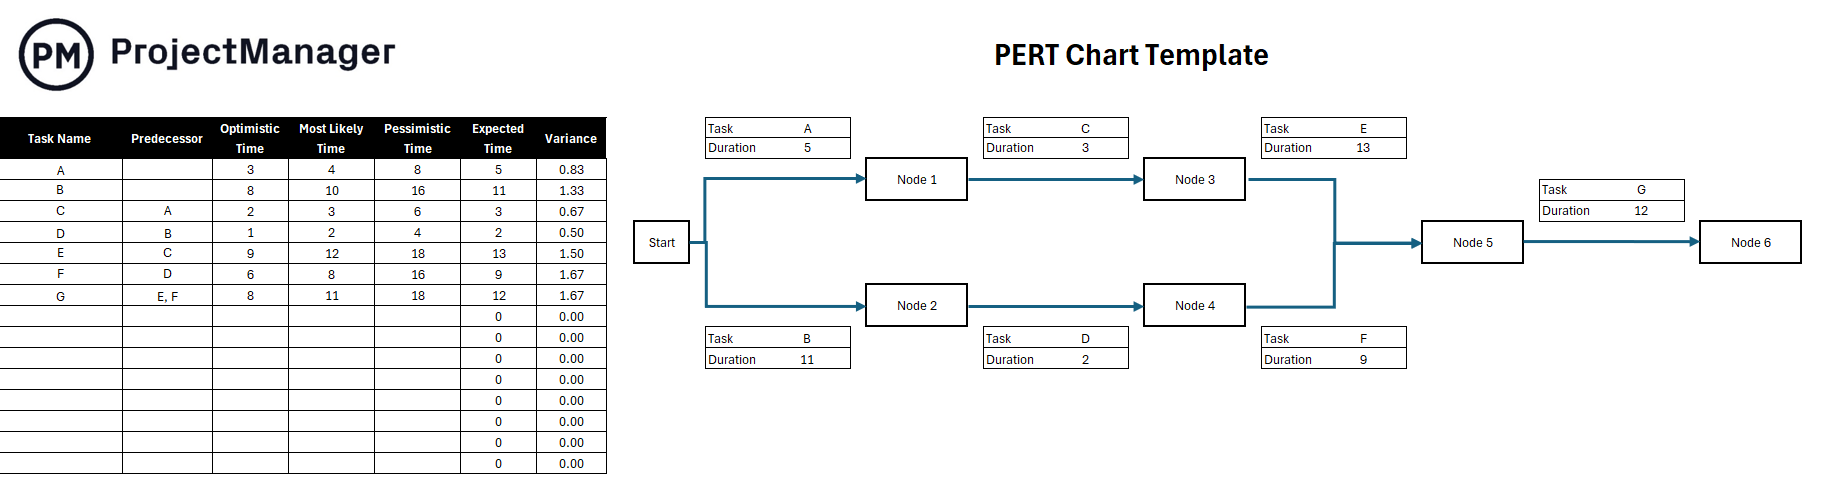
PERT Arrow Diagram Example
The AOA diagram below shows a project with two task sequences that end up becoming one as the project progresses. Rather than identifying the critical path, PERT focuses on accurately estimating the duration of each task, to gauge the length of a project timeline.
Free Tools for Creating Arrow Diagrams
While these network diagrams can be created by hand, it’s not ideal. First, they change, and as they change a whole new diagram must be created. Secondly, using an online tool means the diagram will look more professional as well as be easier to read and share. Here are a few free tools to use to make arrow diagrams.
Draw.io
The free online tool makes a variety of different diagrams. There’s no signup required to use the software to draw. Create a diagram from scratch or use their drag-and-drop shapes on a template.
Google Drawings
Google Drawings Free, (though a Google account is needed to use it), can draw shapes, arrows and more. Project managers can even collaborate with others on the tool and then export the finished diagram as an image file or publish it to the web.
Gliffy
This user-friendly diagram tool works online and offline and can make good diagrams as well as flowcharts, floor plans, technical drawings and more. The free version has most of the bells and whistles of the monthly subscription but can only save to their servers and exported in their format.
Best Practices for Arrow Diagrams
An arrow diagram is a scheduling tool, but it’s best to use only when there is some foresight as to how long each activity will take and what resources will be required to execute them. A clear picture of the logical sequence of those activities is needed.
Of course, the use of an arrow diagramming method focuses on the project schedule. Using this diagram for anything else is not going to get the same results— it’s only useful for project scheduling and the maintenance of the schedule.
The arrow diagram is a useful project management chart and it cuts through the complexity of a project, especially one with many dependencies. Know that, as good as an arrow diagram is, it can not be the only tool when scheduling a project. Project management software is more dynamic and integrates fully with the project.
How ProjectManager Helps You Map Processes
Using an arrow diagram will only get you so far when planning the schedule for your project. For one thing, it’s not part of your larger project management software. ProjectManager is an online tool that integrates scheduling with features that facilitate the execution of the plan to keep you organized and working more effectively.
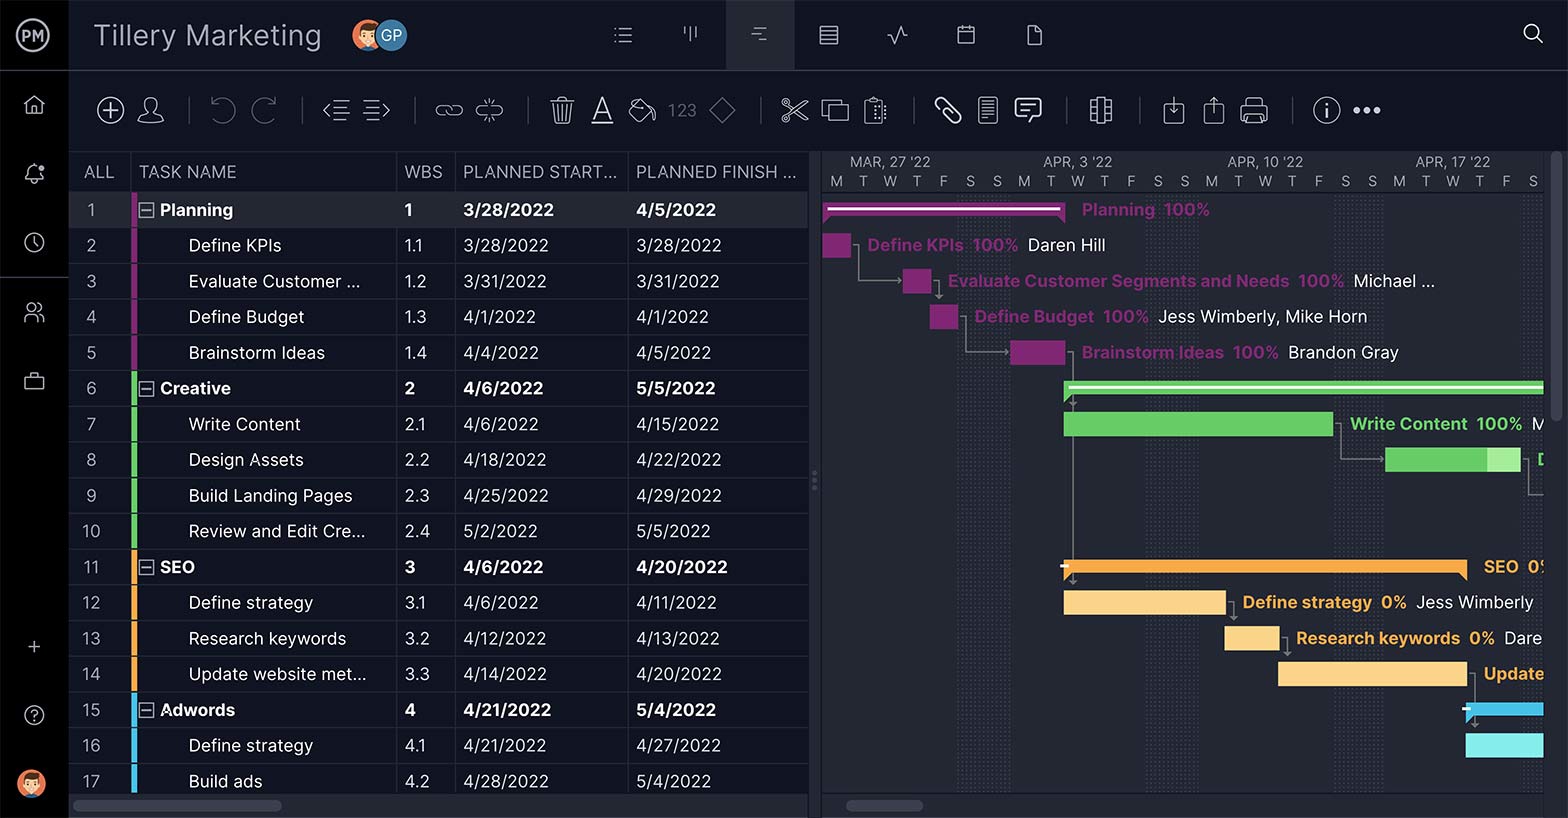
Once you know your tasks, duration and sequence, upload that data into our tool. Open up our online Gantt chart, add the tasks and their start and end dates and you get a visual of the entire project on the Gantt’s timeline. Unlike an arrow diagram, you can link all four types of dependencies to avoid bottlenecks later on in the project.
Find the Critical Path
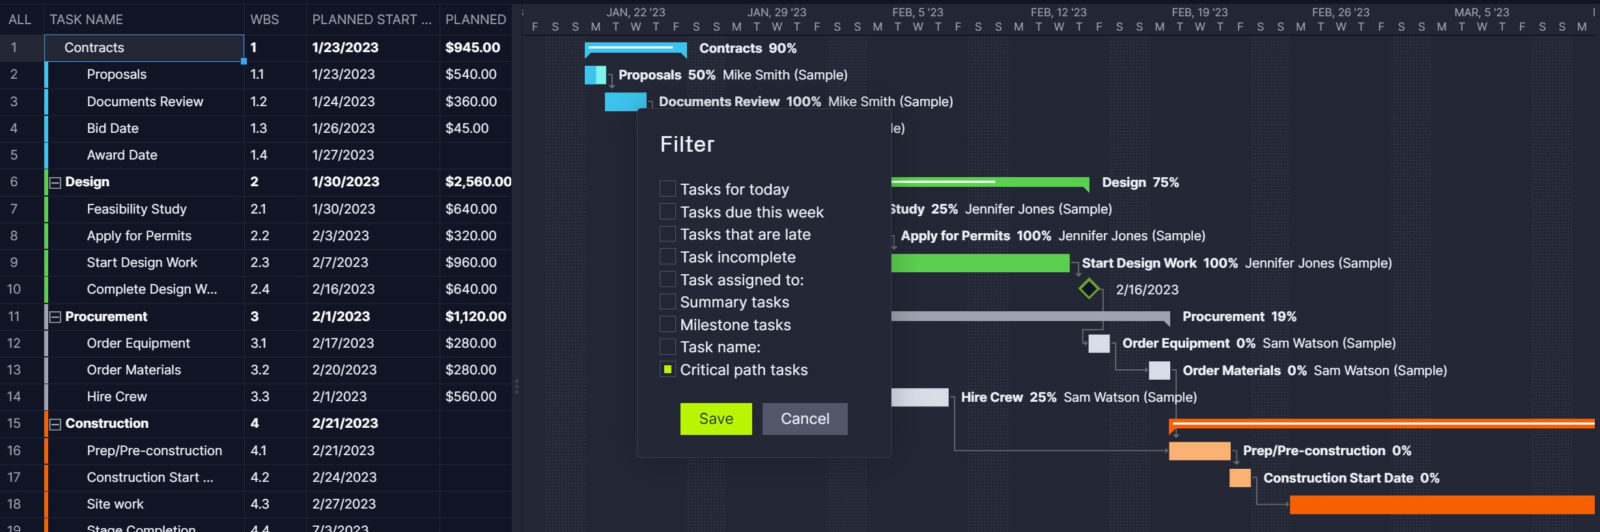
Nodes on the network diagram are like milestones and you can set milestones on the Gantt, too. They’re diamond-shaped icons marking the end of one project phase and the beginning of another or any important date. Then find the critical path by just filtering it on the feature.
Track Your Progress
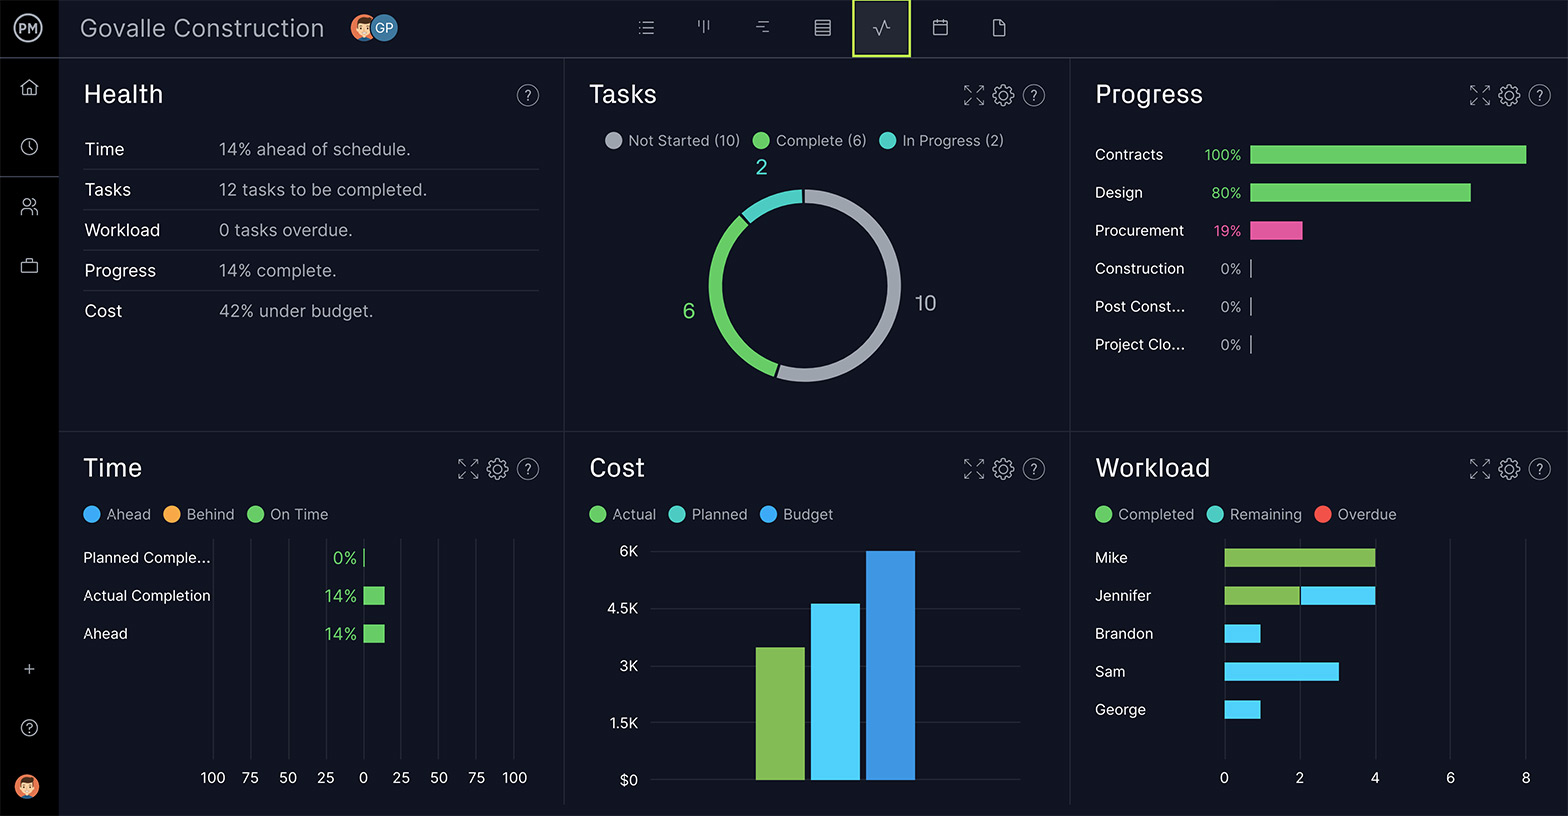
You can’t assign tasks from an arrow diagram, but you can give your teamwork from our Gantt. Each task will have space for you to add descriptions, attach files and images, comment for collaboration, set priorities and deadlines and add tags. Outside of the Gantt are features such as a real-time dashboard for a high-level view of performance, resource management tools, timesheets and so much more.
Related Project Management Charts Content
We’ve written dozens of blogs, templates, ebooks and guides about other project management charts that can be used in conjunction with arrow diagrams. Here are some of them.
- 12 Best Project Management Charts for Project Planning
- How to Create a Workflow Diagram: Examples & Free Templates
- How to Make a Project Network Diagram: Free Tools & Examples
- Gantt Chart vs. PERT Chart vs. Network Diagram
- An Intro to the Precedence Diagramming Method (PDM)
- How to Make a RACI Chart for a Project
- What Is a Burn Up Chart In Agile Project Management?
ProjectManager is award-winning software that organizes tasks, teams and projects for greater productivity. Use our tool to plan, monitor and report on your progress and keep stakeholders informed. It’s the only tool you’ll need to drive your project to a successful end. Try it today with this free 30-day trial.
The post Arrow Diagrams for Projects: Activity on Node vs. Activity on Arrow appeared first on ProjectManager.