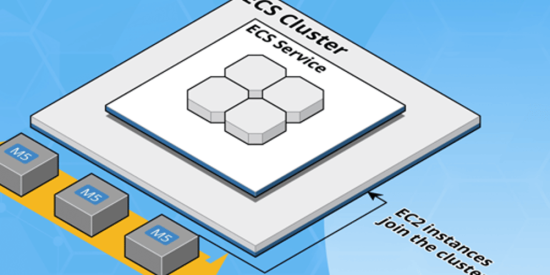
This post is about monitoring an ECS cluster, if you want to learn more about container orchestration with ECS you can see Part 1, Part 2, Part 3. Let’s start by saying the monitoring an Amazon ECS (Elastic Container Service) cluster is essential for tracking resource utilization, performance, and health of your containerized applications. In ECS, monitoring focuses on aspects like CPU and memory utilization, task and container statuses, and network traffic. Amazon CloudWatch is commonly used to monitor ECS clusters by providing metrics, logs, and alarms for observability.
Key ECS Monitoring Components:
- Container Insights: A feature in CloudWatch that provides more granular metrics and analysis on ECS performance.
- CloudWatch Logs: Captures logs from ECS tasks and containers, essential for debugging and tracking application behavior.
- CloudWatch Metrics: These are built-in metrics for CPU, memory, and other resources.
- CloudWatch Alarms: Alerts based on metrics, allowing proactive responses to scaling or failures.
Setting Up Monitoring for ECS Using Terraform
Now let us see how to configure monitoring for an ECS cluster using Terraform.
Note:
AWS EC2 and AWS Auto Scaling natively does not support memory metrics (like Memory Utilization), as it only includes basic CloudWatch metrics like CPU Utilization, Network In/Out, etc. To collect memory metrics, you’ll need to install and configure the CloudWatch Agent on your EC2 instances. If you’re using an Amazon Machine Image (AMI) that doesn’t have the agent pre-installed, you can add it via a user data script in your Auto Scaling Group.
#!/bin/bash
# Install the CloudWatch Agent
sudo yum install -y amazon-cloudwatch-agent

# Update package list and install CloudWatch Agent on Ubuntu
sudo apt-get update
sudo apt-get install -y amazon-cloudwatch-agent
1. Enable ECS Container Insights in Terraform
Container Insights in ECS provides metrics such as memory and CPU utilization at both the cluster and service levels. You can enable Container Insights directly when creating the ECS cluster in Terraform.
resource "aws_ecs_cluster" "ecs_cluste" {
  name = "my-cluster"

  setting {
    name  = "containerInsights"
    value = "enabled"
  }
}
Once enabled, you can view memory usage per container/task and set CloudWatch Alarms based on Container Insights metrics. This can provide insights into container resource usage and help set thresholds for scaling policies.
2. Configure CloudWatch Logs for ECS Tasks
To capture logs from ECS tasks, create a CloudWatch log group in which each container logs data. Then, configure ECS task definitions to send their logs to this group
resource "aws_cloudwatch_log_group" "ecs_task_logs" {
  name              = "https://dev.to/ecs/my-task"
  retention_in_days = 7
}

resource "aws_ecs_task_definition" "task_definition" {
  family                   = "my-task"
  network_mode             = "awsvpc"
  container_definitions    = jsonencode([
    {
      name      = "app-container",
      image     = "nginx:latest",
      cpu       = 256,
      memory    = 512,
      essential = true,
      logConfiguration = {
        logDriver = "awslogs"
        options = {
          "awslogs-group"         = aws_cloudwatch_log_group.ecs_task_logs.name
          "awslogs-region"        = "eu-west-1"
          "awslogs-stream-prefix" = "ecs"
        }
      }
    }
  ])
}
This setup creates a log group and configures each ECS task container to send logs to CloudWatch. The log retention period is set to 7 days.
3. Create CloudWatch Alarms for ECS Metrics
You can configure CloudWatch alarms on key ECS metrics to trigger notifications or actions based on thresholds. For example, you might set up alarms for high CPU or memory usage in your ECS service.
resource "aws_cloudwatch_metric_alarm" "cpu_alarm" {
  alarm_name          = "high_cpu_alarm"
  comparison_operator = "GreaterThanThreshold"
  evaluation_periods  = 2
  metric_name         = "CPUUtilization"
  namespace           = "AWS/ECS"
  period              = 60
  statistic           = "Average"
  threshold           = 80
  alarm_description   = "Triggered when CPU utilization exceeds 80%"

  dimensions = {
    ClusterName = aws_ecs_cluster.example.name
  }

  alarm_actions = [aws_sns_topic.alerts.arn]
}

resource "aws_cloudwatch_metric_alarm" "memory_alarm" {
  alarm_name          = "high_memory_alarm"
  comparison_operator = "GreaterThanThreshold"
  evaluation_periods  = 2
  metric_name         = "MemoryUtilization"
  namespace           = "AWS/ECS"
  period              = 60
  statistic           = "Average"
  threshold           = 80
  alarm_description   = "Triggered when CPU utilization exceeds 80%"

  dimensions = {
    ClusterName = aws_ecs_cluster.example.name
  }

  alarm_actions = [aws_sns_topic.alerts.arn]
}

resource "aws_sns_topic" "alerts" {
  name = "ecs_alerts"
}

resource "aws_sns_topic_subscription" "alert_subscription" {
  topic_arn = aws_sns_topic.alerts.arn
  protocol  = "email"
  endpoint  = "your-email@example.com"
}
In this example, the CloudWatch alarm monitors CPU and memory utilization on the ECS cluster and triggers an alarm if it goes above 80% for two consecutive periods of 60 seconds. The alarm sends a notification to an SNS topic configured to send email alerts.
4. Set Up Detailed ECS Monitoring with CloudWatch Dashboards
You can use CloudWatch Dashboards to visualize metrics for ECS services and clusters. With Terraform, you can define custom dashboards that show CPU and memory metrics for quick, real-time monitoring.
resource "aws_cloudwatch_dashboard" "ecs_dashboard" {
  dashboard_name = "ECS-Dashboard"
  dashboard_body = jsonencode({
    widgets = [
      {
        type = "metric",
        x    = 0,
        y    = 0,
        width = 6,
        height = 6,
        properties = {
          metrics = [
            ["AWS/ECS", "CPUUtilization", "ClusterName", aws_ecs_cluster.my_cluster.name],
            ["AWS/ECS", "MemoryUtilization", "ClusterName", aws_ecs_cluster.my_cluster.name]
          ]
          title = "ECS Cluster CPU and Memory Utilization"
          view = "timeSeries"
          stacked = false
          region = "us-west-2"
          period = 300
          stat = "Average"
        }
      }
    ]
  })
}
This dashboard contains a widget showing CPU and memory utilization for the ECS cluster. You can customize the dashboard to display metrics for specific services, tasks, or additional resources in your ECS cluster.
Summary
- Enable Container Insights to get granular metrics on your ECS cluster and services.
- Set Up CloudWatch Logs to capture ECS task logs and make debugging easier.
- Create CloudWatch Alarms for proactive alerts on resource usage, task health, and other custom metrics.
- Use CloudWatch Dashboards for real-time visual monitoring of ECS cluster and service performance.
By setting up these components with Terraform, you achieve consistent and automated monitoring, giving you insight into the performance and health of your ECS cluster and services. This configuration is especially useful in production environments where proactive monitoring is essential for maintaining application uptime and resource efficiency.

![[sep]-ml-community — highlights-and-achievements](https://prodsens.live/wp-content/uploads/2024/11/28379-sep-ml-community-highlights-and-achievements-110x110.jpg)


