One of my favorite charting libraries, chart.js is built around the canvas,
The goat of ML and Deep learning tensorflow.js, can use webgl for computation, which is faster than both the CPU and WebAssembly.
Guess what, the canvas API provides a webgl context:
const canvas = document.createElement("canvas");
const webgl = canvas.getContext("webgl");
All this is usually reserved for lower level languages, it’s undeniable the browser is powerful,
made even more by web API’s,
granting us lower level acess and control,
We can animate, do game graphics/engine, physics simulation, data visualization, photo-manipulation, real-time video processing etc etc
all with the canvas.
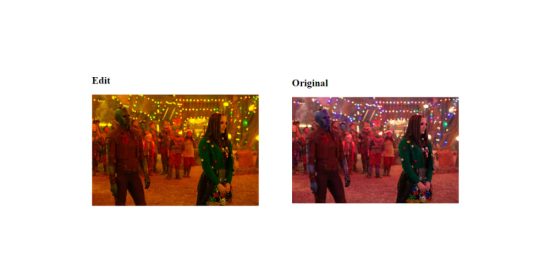
This article will explore one of those possibilities, pixel by pixel image manipulation.
- The Canvas API: an overview
-
Image manipulation
- Pixel data
- Saving the Image
The Canvas API: an overview
A book on the power of the canvas and potential applications can span 1000’s of pages,
We will cover only the necessary basics,
create a new project folder, with the following structure:
 imgs
 src
   app.js
 index.html
Copy and Paste the below HTML starter:
lang="en">
charset="UTF-8">
http-equiv="X-UA-Compatible" content="IE=edge">
name="viewport" content="width=device-width, initial-scale=1.0">
</span>Live Img editor<span class="nt">
class="graphics">
style="display: grid;">
Edit
id="canvas" width="600" height="400">