Project management tools and techniques make planning and managing projects easier and more effective. They can be applied to any project, regardless of the field or industry. And used in tandem with project management software, they help save time and reduce costs.
We’ve compiled 15 of the best project management tools and techniques that every project manager should know in order to control their projects and steer them to successful ends. Let’s first review project management tools, to then review the project management techniques in which they can be used.
1. Gantt Charts
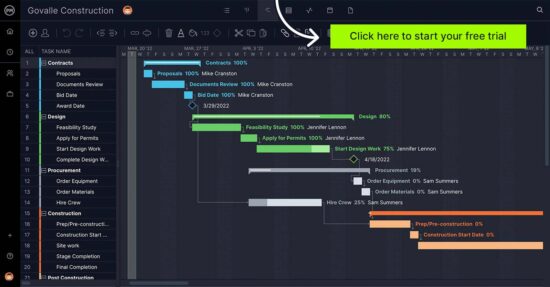
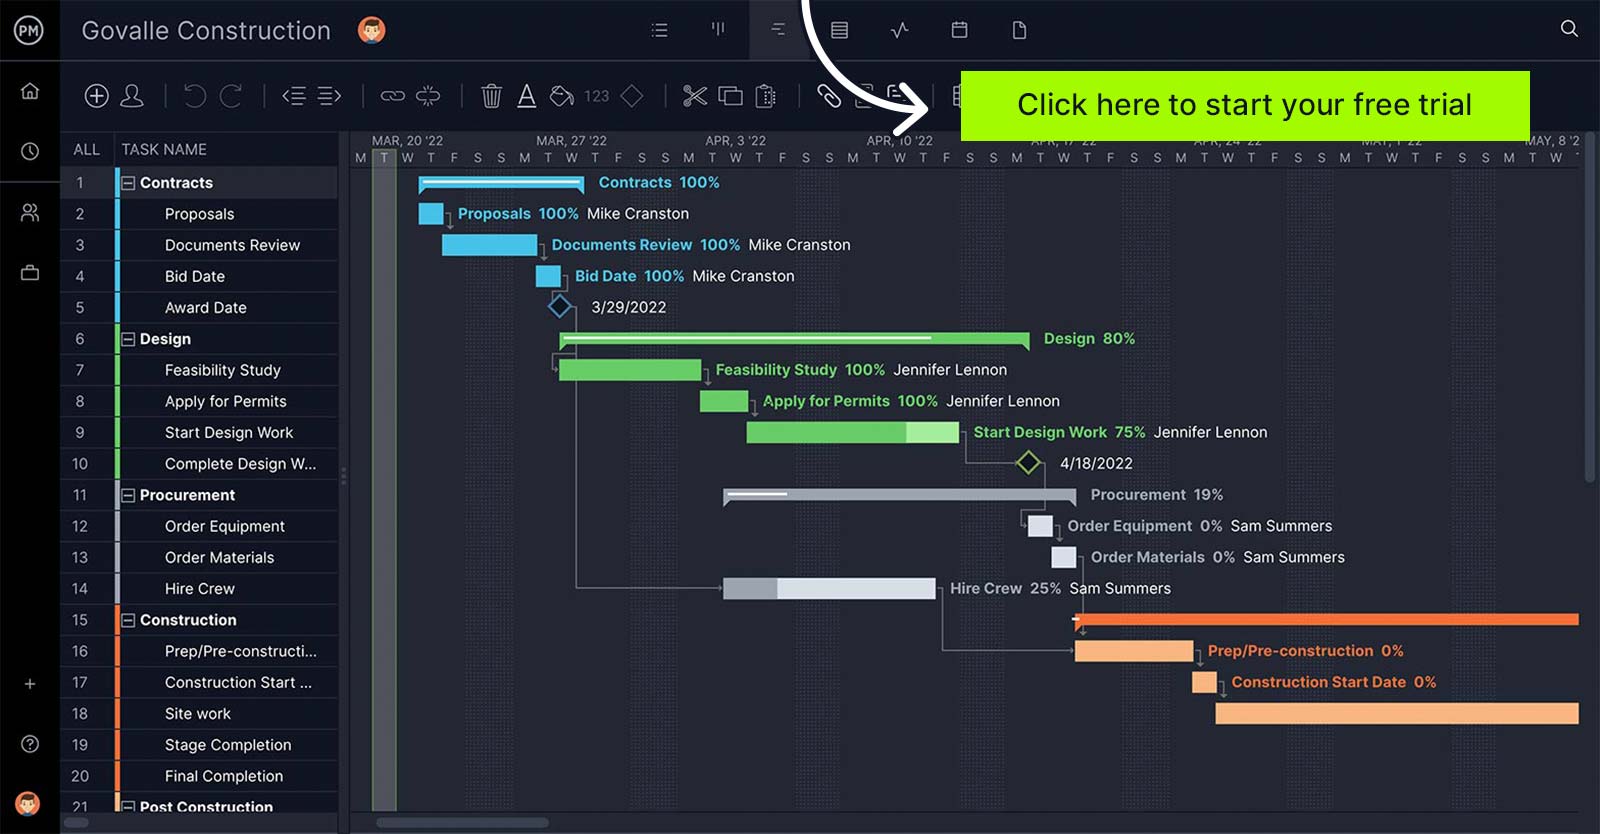
Gantt charts are one of the most important project management tools due to their versatility. Gantt charts can be used throughout the various phases of your projects to help with project planning, project scheduling and project tracking.
Gantt charts facilitate the process of creating a project timeline. If you’re using the online Gantt chart in ProjectManager, you simply need to add tasks and due dates to the software and automatically create interactive project plans. Then you can adjust your project schedules as needed and link dependent tasks, by just clicking and dragging items on the timeline.
Task dependencies can be linked on ProjectManager, so that there are no bottlenecks or downtime. Project managers can automate notifications on upcoming deadlines to keep the project on track. When the team updates their status, task management and resource management information is instantly reflected throughout ProjectManager, so everyone is always on the same page. Get started today for free.
2. Work Breakdown Structure (WBS)
Projects big and small can feel overwhelming at first glance. There’s so much to do. The idea of just jumping in and learning how to swim is how projects drown in lost time and costs. As any experienced project manager knows, everything must first get planned before putting it into action.
A work breakdown structure (WBS) is a way to organize the work into smaller, more manageable pieces. According to the Project Management Body of Knowledge (PMBOK), WBS is a “deliverable oriented hierarchical decomposition of the work to be executed by the team.”
What that means is the WBS is graphic representation of every task in the project. At the top is the final product with a line that goes down the page to a box (or boxes) that represent the larger tasks which lead to that completed project. Each of these boxes are then attached with lines that go under it to smaller tasks.
Work breakdown structure diagrams are a very popular project management tool, typically used in project management techniques such as the critical path method (CPM) or the Program Evaluation Review Technique (PERT).
3. Project Network Diagrams
Project network diagrams are graphical representations of a project. They look like a series of arrows that connect to boxes, but in fact show how activities interact in a project. The boxes are called nodes and they represent an activity in the project, while the arrows show the relationship among the activities.
Network diagrams work well as a project management technique as they must have a start and finish, just like a project. There isn’t one way to draw a network diagram, however the most common are precedence diagramming method (PDM) and arrow diagramming method (ADM).
The purpose of the network diagram in terms of project management techniques is that it helps a project manager track each element of a project. It also makes it easier to share and communicate this with others on the project team. Network diagrams are used in various project management techniques that require a graphical representation of task sequences.
4. Kanban Boards
Kanban boards are a visual task management tool that consists of a board and moving cards that represent activities. Project managers and team members use them to collaborate as they work on projects. Kanban boards let them visualize their workflows, assign tasks, and report on their progress. Kanban boards can be used for workflow management by a wide variety of teams, from marketing to agile software development. They’re also used as part of techniques such as lean manufacturing.
Project management software takes kanban to the next level. ProjectManager has a board view that syncs with all its other project views, allowing teams to work however they want. All updates are reflected throughout the tool. Teams love how they can manage their backlog and plan sprints. Managers get the transparency they want to see potential blocks and reallocate resources quickly to keep production moving ahead smoothly.
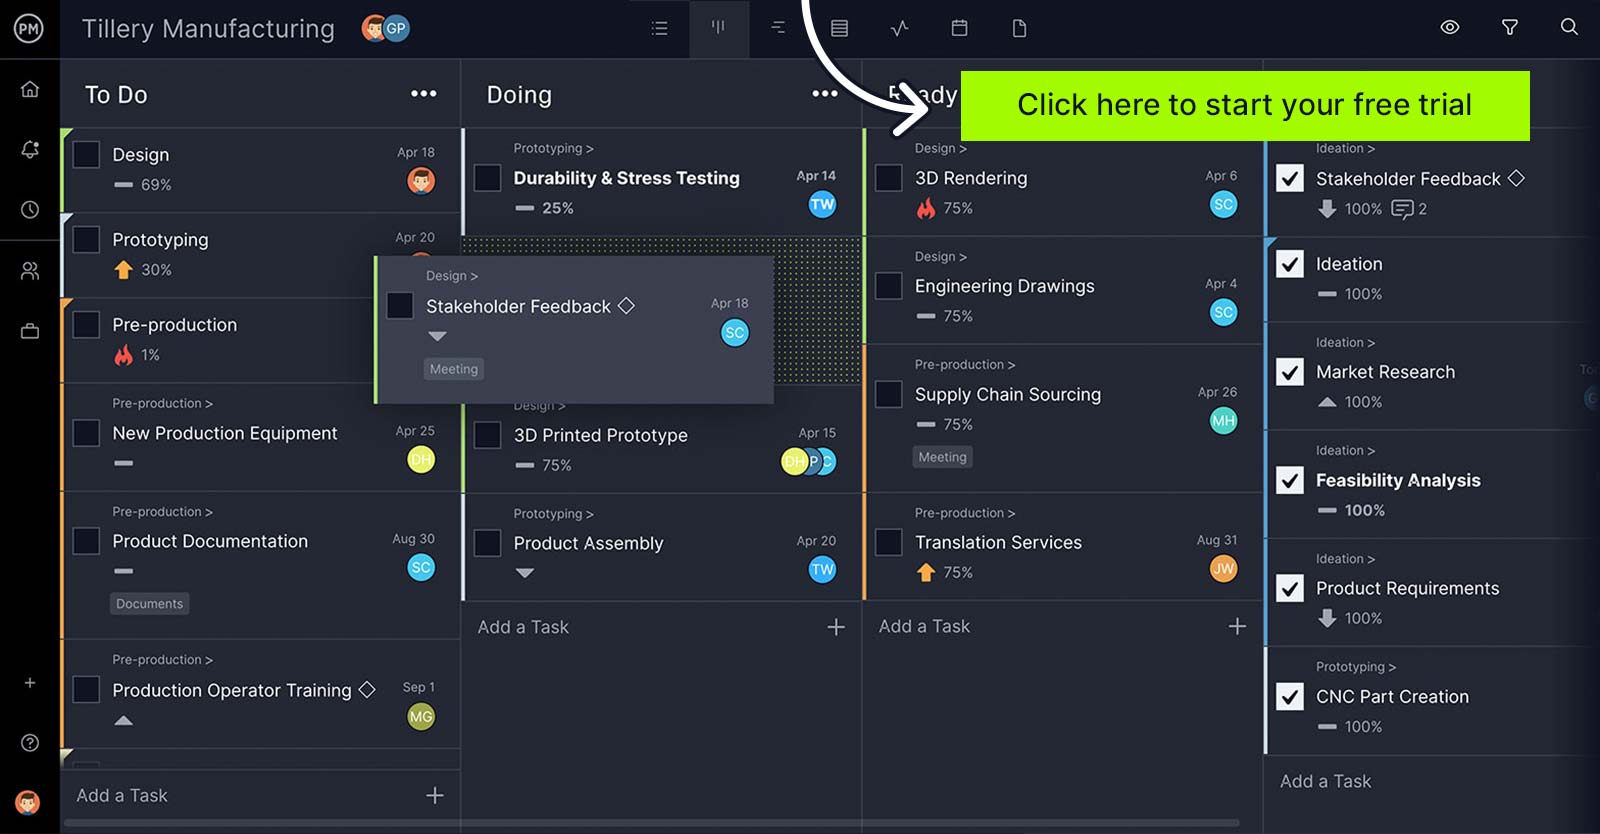
The project board helps team members visualize what they must get done today, seeing their task in the wider context of the others. This limits the amount of work in progress (WIP) and balances the workflow to avoid overburdening the team. Because the cards on the board can be prioritized, workflow is improved. Once one task is done, the card is moved to the next column and the team member starts on the card that on top of their to-do column.
5. Risk Matrix
A risk matrix is another key project management tool any project manager should know about. They’re a simple tool that helps you to figure out the likelihood and severity of potential project risks. By having a means to access risk this way, you can chart their impact in the project. This allows project managers to assign a priority to the risk and help determine the response if it does become an issue in the project. For these reasons, you should always use a risk matrix, risk log, or other risk management tools when planning your projects, regardless of the project management techniques you choose to apply.
There are many different types of risk that a project manager must be on the lookout for. Some common risks include strategic, operational, financial, technical and external risks. Remember, not all risks are bad. Some can be taken advantage of and positively impact the project.
6. Timesheets
Teams need to get paid and timesheets are a tool that do that. As in any employment, timesheets are a way to track the amount of hours a person has worked over the course of a specific time, usually a week or biweekly.
In project management, timesheets do more than just facilitate payment. They are used as project controls to record the amount of time that the team member has spent on their specific tasks, though it can also track time on a project or for a particular client.
Timesheets can be used in a variety of different modes, from paper to spreadsheets and software. Cloud-based timesheets can even update in real time. However you use a timesheet, they are vital for payment, meeting deadlines and keeping to your budget.
7. Project Dashboards
Just as you have a dashboard on vehicles that gauge speed, amount of fuel remaining in the tank and mileage, project dashboards track metrics in the project. It’s one page in which you can view the project’s progress and performance at a glance.
This is a key tool for getting high-level data on the project or conducting a project management audit. It is a visual tool that turns the hard data into easy-to-read charts and graphs, which helps make the information more digestible.
Some of the metrics that dashboards display can be cost-related, task-related or about the overall health of the project. Dashboards can also show workload and other resource management metrics. They are an essential part of any project management software.
8. Project Reports
Project reports are simply documentation that detail either an overview of details of a project. There are many different types of projects, each serving a different purpose, but all helping to give a project manager data on the progress and performance of their project.
Another aspect of project reporting as a project management technique is that it’s a communication tool. As noted, it communicates valuable project details to the project manager. But it also provides the project manager with a means of updating the project stakeholders, all of whom have a vested interest in the project’s success.
One of the more common project reports is the status report, which is usually a weekly or monthly. But there are also progress reports, workload reports, which are crucial to resource management, and even reports that look at risk, cost-benefit analysis and project variance.
Now that we’ve learned what these project management tools, let’s see how they can be used as part of the following project management techniques.
9. Agile Project Management
Agile is a way to approach projects in an iterative fashion with short durations of work. These periods are called sprints. Agile sprints begin with planning, which is typically done using task lists and kanban boards. A product owner, who requests the work, and the development team decide on what work will be done during the sprint.
The development team has the final say in terms of what work will be accomplished during the sprint, while the product owner defines the criteria by which the work will be considered done and approved.
Also, in this process, is a scrum master who is an expert on the scrum framework and will determine the length of the sprint. There are artifacts that provide information to the scrum team. These include backlog, burndown charts and user stories.
10. PERT
PERT is an acronym that stands for program evaluation and review technique. It’s a project management technique to help with time estimates. Scheduling is critical to getting a project completed on time, obviously, but also within the set budget. The longer you work, the more you pay.
So, how does PERT work? It manages probabilities by using network diagrams and simple statistical methods. PERT breaks down tasks into detailed activities, by using the WBS discussed above, then adds these to a PERT diagram to identify those activities that are interdependent. From that data, you create an illustrative map of the network of activities and their interdependencies.
On the map, a node represents an event and the activities are represented by arrows drawn from one event to another based on its order. From this, the earliest time (TE) and the latest time (TL) for each activity is figured out, as well as the slack time for each activity.
11. Critical Path Method (CPM)
Critical Path Method (CPM) is a cornerstone of project management techniques. CPM involves the use of network diagrams, WBS and Gantt charts. CPM consists in using these tools to create a project timeline and identify the critical path, which is the longest sequence of activities in the project. The activities in the critical path are known as critical tasks and have the highest priority in terms of project scheduling. Now you know what tasks are critical to the project and which have float or can be delayed without lengthening the project timeline. With this information, you can figure out the shortest time needed to complete the project.
Not all project management tools can filter the critical path automatically. You have to do the calculations yourself. But ProjectManager’s online Gantt chart finds the critical path with a click, saving you valuable time. Once your schedule is planned, set the baseline on the Gantt chart view. This allows you to compare your actual progress versus the planned effort, which helps you stay on track.
12. Cost-Benefit Analysis
A cost-benefit analysis looks at the investment into a project and what that return might be. This is a value project management technique to help decide which projects are viable and which ones are better off being passed.
The idea is simple: add up the costs of the project and then the value from a business perspective, whether that’s benefits or opportunities. If the benefits outweigh the costs, then the project is more likely worth pursuing. If not, you might save yourself a loss by turning it down.
The value of such a project management technique is clear in terms of making organizational decisions. It helps you view the project in terms of its return on investment (ROI) and your organization’s value chain. This is a data-driven way to make a decision as opposed to betting on your gut.
13. Earned Value Management
Earned value management (EVM) is used in project management. It integrates schedule, costs and scope as a way to measure performance on a project. By looking at planned and actual values, EVM can help make predictions that allow project managers to better manage. Project managers use tools like WBS, gantt charts and project dashboards as they implement EVM.
Predicting the future is never wholly accurate, but according to studies, once 20 percent into a project EVM does a pretty good job. Therefore, it’s often used to control project costs.
Other benefits include reducing unknowns into quantifiable factors. It can also be used to compare and benchmark current project status with the project baseline, as well as provide insights into projects and portfolios.
14. Stakeholder Mapping
Stakeholders have a vested interest in the project. But they can also influence your project. Therefore, project managers need to know who the project stakeholders are and how they might influence the project.
That’s where the project management technique of stakeholder mapping comes in. It’s a visual process that lays out all the project stakeholders and lets the project manager know how to deal with the stakeholders, which ones need to know what and when.
Stakeholders can be varied. Customers or users of a product are stakeholders, but so are industries and markets, suppliers and investors. They can be new or old customers, retailers or even the project team, such as the project manager, developer, design or executive. But in general, they can be broken up into two categories: internal and external. Project dashboards and Gantt charts can then be used to report on progress and keep stakeholders informed.
15. Feasibility Study
There are many ways to determine if a project is worth undertaking or not. One such project management technique is the feasibility study. It’s a way to evaluate if the project plan is practical and will lead to a successful outcome that you should move forward with.
Some of the things a feasibility study looks at include if you have the resources to complete the project and if the ROI makes it beneficial or financially advantageous to take on the project.
A feasibility study will commence after the project has been pitched but prior to any work having started. It’s part of the planning phase of the project and done with a SWOT analysis or project risk assessment. A feasibility study looks at things such as market opportunities, pros and cons and so forth.
Free Project Management Templates
Project management techniques are best executed with project management software, which fosters efficiency and connects teams to work better together. If you’re not ready to upgrade to project management software, ProjectManager also has free templates that you can download. There are dozens of templates that can apply to every phase of a project. Here are only some of the many free project management templates for Excel and Word that you can use.
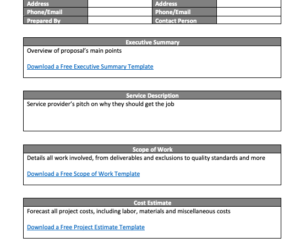
Project Budget Template
Every project has to be funded. But the cost has to be accurately forecast beforehand. Our free project budget template for Excel helps you estimate labor, materials and other costs to build the financial foundation to support your project.
Project Plan Template
All the work involved in delivering a project can be daunting until you create a plan to organize those tasks. Using our free project plan template for Word allows you to scope your project and break it down into smaller, more manageable phases.
Gantt Chart Template
Gantt charts are visual planning and scheduling tools that get a bad rep for being difficult to make. When you download our free Gantt chart template for Excel you just have to fill in your tasks and the bar chart is automatically built for you.
Work Breakdown Structure Template
The larger project needs to be broken down into smaller deliverables and tasks in order to better manage it. With the free work breakdown structure (WBS) template for Excel it’s easy to make a thorough inventory of all your work needed to deliver a successful project.
Action Plan Template
Project goals aren’t achieved without strategy. When you use our free action plan template for Excel you can outline those steps that will lead you to reaching those goals. Use this free template to organize your tasks (action steps) and subtasks (action items).
ProjectManager is a cloud-based project management software that has features that enhance project management techniques and integrates them with a real-time dashboard to monitor and report on progress. Online Gantt charts can upload WBS and other MS Project or spreadsheets to give you greater control. While our Kanban boards visualize the workflow and help teams collaborate and work more efficiently together. Try it for free by taking this free 30-day trial.
Related Content on Project Management Techniques
- How to Execute a Needs Assessment
- Benefits Management for Projects: How to Make a Benefits Management Plan
- How to Conduct a Gap Analysis: Definition, Steps & Example
- Root Cause Analysis: A Quick Guide
- Records Management: A Quick Guide
- Using DACI Framework for Better Group Decisions
- How to Prioritize with the MoSCoW Method
- Gantt Chart vs. PERT Chart vs. Network Diagram
The post 15 Project Management Tools & Techniques for Project Managers appeared first on ProjectManager.