TL;DR:
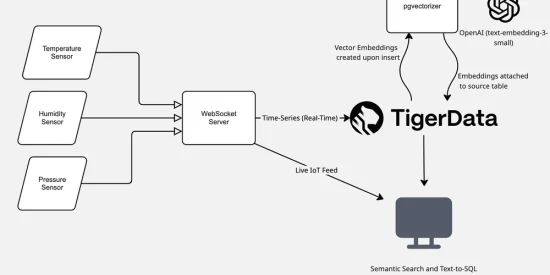
You can now use PostgreSQL to handle a wide range of workloads—including time-series, vector search, and transactional queries. I built a lightweight app using Tiger Data’s PostgreSQL cloud and OpenAI to enable Text-to-SQL and Semantic Search on real-time IoT data.
Why PostgreSQL?
PostgreSQL has gained massive adoption in recent years thanks to its reliability, extensibility, and familiarity. It’s used in some of the most mission-critical applications today—for good reason.
To explore its versatility, I built an IoT-focused app that collects real-time data from simulated sensors and layers on AI-powered querying and search. The goal: show how far you can take a single database when you combine time-series, vector search, and LLMs—all from within PostgreSQL.
Why Tiger Data?
Tiger Data made sense for this project for two key reasons:
- IoT data is inherently time-series – I wanted to leverage the TimescaleDB extension to efficiently store and aggregate time-stamped sensor readings.
- AI-native PostgreSQL – Tiger Data has built cutting-edge AI features directly into PostgreSQL through their pgai suite, making it easier to embed and search data using OpenAI models.
Stack Highlights
- TimescaleDB is a PostgreSQL extension that optimizes time-series data ingestion and analysis.
- pgai is a suite of tools that turns PostgreSQL into a production-ready engine for Retrieval-Augmented Generation (RAG) and agentic applications.
🔄 Automatically generates and syncs vector embeddings from table data or documents via pg_vectorizer
🔍 Enables fast, native vector and semantic search via pgvector and pgvectorscale.
Together, TimescaleDB and pgai let you ingest high-volume time-series data and create real-time vector embeddings—all on the original source table.
- WebSocket connections for persistent bidirectional communication enabling real-time IoT device data ingestion and live dashboard updates
- OpenAI for query embedding generation and record embeddings
- React & Next.js for front-end

Technical Implementation Notes
PostgreSQL Table Definition and Log Feed
The core of the system is a sensor_readings table that stores incoming IoT data. Each row represents a single reading from a device, complete with metadata such as location, value, and timestamp.
-- Create the sensor_readings table with proper structure
CREATE TABLE IF NOT EXISTS sensor_readings (
    time TIMESTAMPTZ NOT NULL,
    device_id TEXT NOT NULL,
    device_type TEXT NOT NULL,
    location TEXT,
    raw_value NUMERIC,
    unit TEXT,
    log_type TEXT NOT NULL DEFAULT 'INFO',
    message TEXT NOT NULL,
    CONSTRAINT sensor_readings_pkey PRIMARY KEY (time, device_id)
);

SELECT create_hypertable('sensor_readings', 'time', if_not_exists => TRUE);
To optimize for time-series performance, the table is converted into a hypertable using TimescaleDB. This enables efficient inserts, compression, and aggregations over time-based data.
Automatic Embeddings with Tiger Data’s Vectorizer
Once the table is in place, Tiger Data enables you to define a vectorizer—a serverless function under the hood—that automatically creates and maintains an embedding column.
Every time new data is inserted or existing data is updated, the vectorizer will generate or update the corresponding vector embedding in real-time using OpenAI’s text-embedding-3-small model:
SELECT ai.create_vectorizer(
    'public.sensor_readings'::regclass,
    loading => ai.loading_column('device_id'),
    chunking => ai.chunking_none(),
    destination => ai.destination_column('embedding'),
    embedding => ai.embedding_openai('text-embedding-3-small', 1536, api_key_name=>'OPENAI_API_KEY'),
    formatting => ai.formatting_python_template(
        'The device id is: $device_id and has a device type of: $device_type. The location of this device is: $location and it recorded a raw value of: $raw_value with a unit of: $unit. The log type is: $log_type and this was recorded at the following time: $time'
    )
);
Example Record After Vectorization
Once the vectorizer is in place, inserting a record like the one below will automatically produce a corresponding embedding:
time: 2025-07-01 17:14:41.456252+00
device_id: device_004
device_type: camera
location: parking_lot
raw_value: 1
unit: boolean
log_type: INFO
message: Camera feed: Normal surveillance activity in parking_lot
embedding: [0.010583181, -0.006653716, -0.011511296, …]
Fast Aggregations with Continuous Aggregates
Since the data is stored in a hypertable, TimescaleDB’s continuous aggregates can be layered on top to support fast and efficient rollups—ideal for dashboards or powering text-to-SQL queries.
Here’s how I set up 5-minute and hourly aggregates over the sensor_readings table:
CREATE MATERIALIZED VIEW IF NOT EXISTS five_min_sensor_averages
WITH (timescaledb.continuous) AS
SELECT
    time_bucket('5 minutes', time) AS five_min_bucket,
    device_type,
    location,
    avg(raw_value) as avg_value,
    min(raw_value) as min_value,
    max(raw_value) as max_value,
    count(*) as reading_count
FROM sensor_readings
WHERE raw_value IS NOT NULL
GROUP BY five_min_bucket, device_type, location;

-- Level 2: Hourly aggregates built on top of 5-minute aggregates
CREATE MATERIALIZED VIEW IF NOT EXISTS hourly_sensor_averages
WITH (timescaledb.continuous) AS
SELECT
    time_bucket('1 hour', five_min_bucket) AS hour,
    device_type,
    location,
    avg(avg_value) as avg_value,
    min(min_value) as min_value,
    max(max_value) as max_value,
    sum(reading_count) as reading_count
FROM five_min_sensor_averages
GROUP BY hour, device_type, location;
Routing Between Text-to-SQL and Semantic Search
My application supports two different AI query modes:
Text-to-SQL for structured, analytical queries like “What’s the average temperature in the last 24 hours?”
Semantic Search for unstructured, investigative prompts like “Why did the camera in the parking lot report unusual activity?”
To determine which path to take, I built a lightweight classifier that scans for keywords in the incoming query. Here’s the core logic behind it:
func (s *AIService) determineQueryType(query string) string {
    queryLower := strings.ToLower(query)

    // Keywords that suggest specific data queries (use text-to-SQL)
    dataKeywords := []string{
        "show me", "what is", "how many", "average", "count", "temperature",
        "humidity", "motion", "camera", "controller", "device", "location",
        "last hour", "last 24 hours", "yesterday", "today", "this week",
        "above", "below", "between", "greater than", "less than",
        "raw_value", "unit", "time", "hour", "day", "week", "month",
    }

    // Keywords that suggest pattern discovery (use semantic search)
    patternKeywords := []string{
        "why", "how", "patterns", "similar", "unusual", "anomaly", "problem",
        "issue", "failure", "error", "warning", "critical", "security",
        "behavior", "trend", "insight", "analysis", "explain", "understand",
        "find logs", "search for", "discover", "investigate",
    }
If the query includes terms related to measurements, time ranges, or specific metrics, it’s routed to the text-to-SQL engine. If it contains exploratory or investigative language, it goes to semantic search.
This design allows for a more natural and intuitive user experience—people can ask questions however they like, and the system adapts accordingly.
Summary
This project shows how far you can go using just PostgreSQL as the foundation. By combining:
- TimescaleDB for efficient time-series ingestion and continuous aggregates
- pgai for vector embeddings and semantic search
- OpenAI for both embeddings and natural language SQL generation
- Tiger Data Cloud to tie it all together