What Is a Gantt chart?
A Gantt chart is a stacked bar chart that organizes the work activities of a project on a timeline that shows their duration and dependencies and allows project managers to assign them to their team members. Gantt charts are an important project planning and scheduling tool.
On the left of a Gantt diagram is a list of the tasks, and to the right is the bar chart timeline in which those tasks are placed according to when they occur in the project. Each task is laid out with a start date and an end date. That’s the duration of the task. It is graphically a line between two points.
This layout makes it simple for project managers to see what the tasks are, when each of them begins and ends and how long the task should take to complete. The Gantt chart also shows where tasks overlap, by how much, as well as the duration of the entire project. Gantt charts have been around for a long time, but since they migrated from analog to digital, their ease of use has made them a staple of project management.

Why Make a Gantt Chart?
Gantt charts are versatile project management tools that have various purposes. They are used to plan, schedule and monitor projects across industries. Here’s a quick overview of how Gantt charts are used throughout the project life cycle and when managing business processes or workflows.
Project Planning and Scheduling
During the planning stage, Gantt charts help project managers visualize the project timeline so that they can define what resources are needed and when, how to assign workload, and also understand what are the critical path activities of a project.
Then, once all the project activities are included in the Gantt chart, it’s easier to create an accurate project schedule to execute the project plan on time. So, a Gantt chart shows you what tasks are needed to complete the project, and how long they are going to take. But how do you make one to plan and schedule a successful project? The following are the five steps to make a Gantt chart.
Resource Allocation and Tracking
Gantt charts help with resource allocation in several ways. Resources, whether human or nonhuman, can be assigned directly to tasks, which makes it easier to see who is responsible for what. Project managers can use Gantt charts to assess resource workloads visually, which helps them balance tasks and avoid overloading any single resource. When a Gantt chart is updated in real time, project managers can better track the progress of tasks and their associated resources. Adding milestones also helps monitor progress.
Project Monitoring and Control
More than just a scheduling tool, the Gantt chart is a visual tool for tracking progress. Taskbars are shaded to represent the percentage complete for that particular task. Milestones, as noted above, are another way to monitor progress. Visualizing task durations and dependencies helps project managers spot delays and identify tasks that are behind schedule, which allows for a quick intervention. Managers can also see how delays in one task affect subsequent tasks.
How to Make a Gantt Chart
There are a few ways to make a Gantt chart. If you want to be a traditional project manager, you can get out a paper and pencil. That might be a good way to start putting your plan together, but it’s not feasible for managing a project, with all its issues and changes.
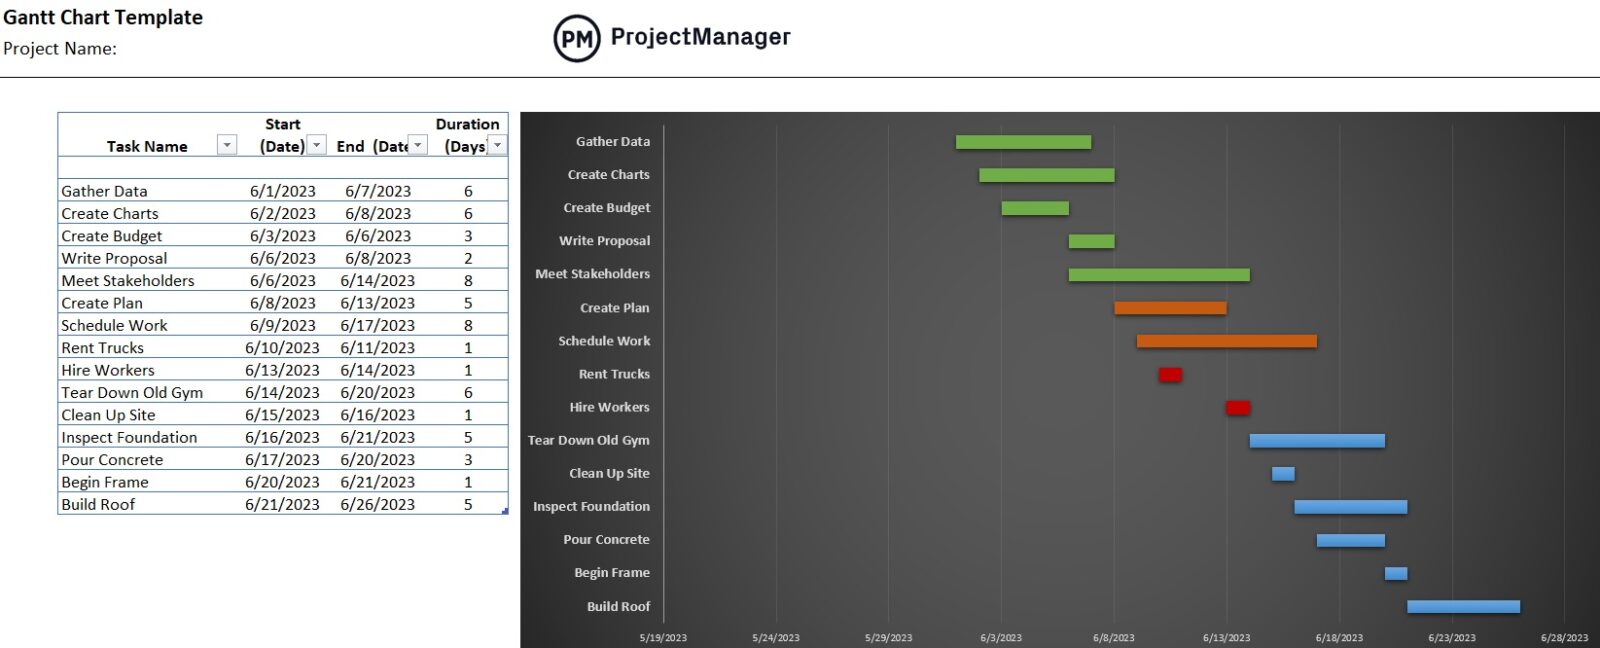
To make things easier, we offer a free Gantt chart template, which gives you an Excel spreadsheet to fill in the fields. But if you keep your schedule on a spreadsheet, it’s going to be a problem. Excel was created to make easy and visual timelines, but it’s not a project management tool. What you really need is project management software with a Gantt chart maker feature. We recommend uploading the spreadsheet to our online Gantt chart software.
Get your free
Gantt Chart Template
Use this free Gantt Chart Template for Excel to manage your projects better.
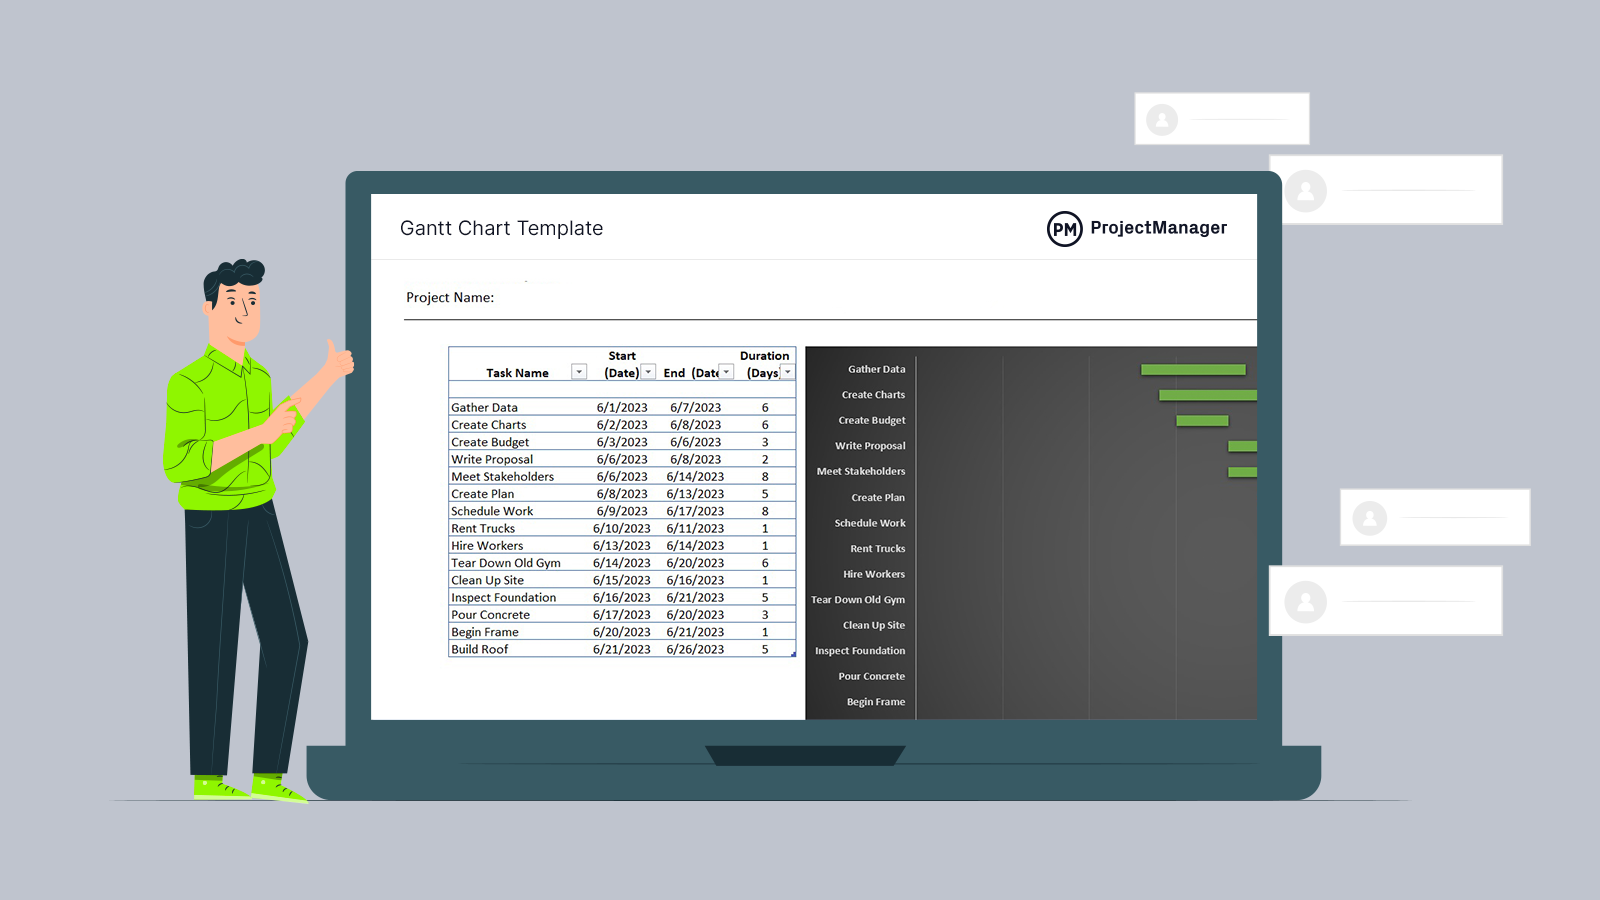
Now, let’s go through the steps that need to be followed to make a Gantt chart using ProjectManager. But before we do so, here’s what a Gantt chart should look like.
As stated above, it has two main parts, a Gantt chart table or grid that includes project tasks and their due dates, duration and costs among many other details and a stacked bar chart that represents the project schedule. We’ll zoom into each of their elements as we learn how to make a Gantt chart using project management software. To do so, you’ll need to start a free trial of ProjectManager.
Once you go through the following steps, take a moment to read on. We’ll explain how putting your Gantt chart online into our software makes it a living document that can not only plan your schedule, but help you execute it and how you can use other ProjectManager tools such as real-time dashboards, timesheets, project management reports and much more.
1. Make a Task List
Before you can map out the work you have to have a list of it. This list of tasks must be thorough and complete to be effective. Therefore, it’s advised that you use a work breakdown structure (WBS).
This tool, like its name, breaks down larger, complex (or small, simpler) projects down to divide the work into individual activities. It starts with the final deliverable and goes step by step backward to get the essential steps necessary to get to the project’s end.
As you’re gathering tasks, it doesn’t hurt to look back at historical data of related projects to get an idea of their duration. Also, talking to people who have gone through similar projects, be they inside or outside your team, can help as you move to the next step.
Related: Work Breakdown Structure (WBS) Template
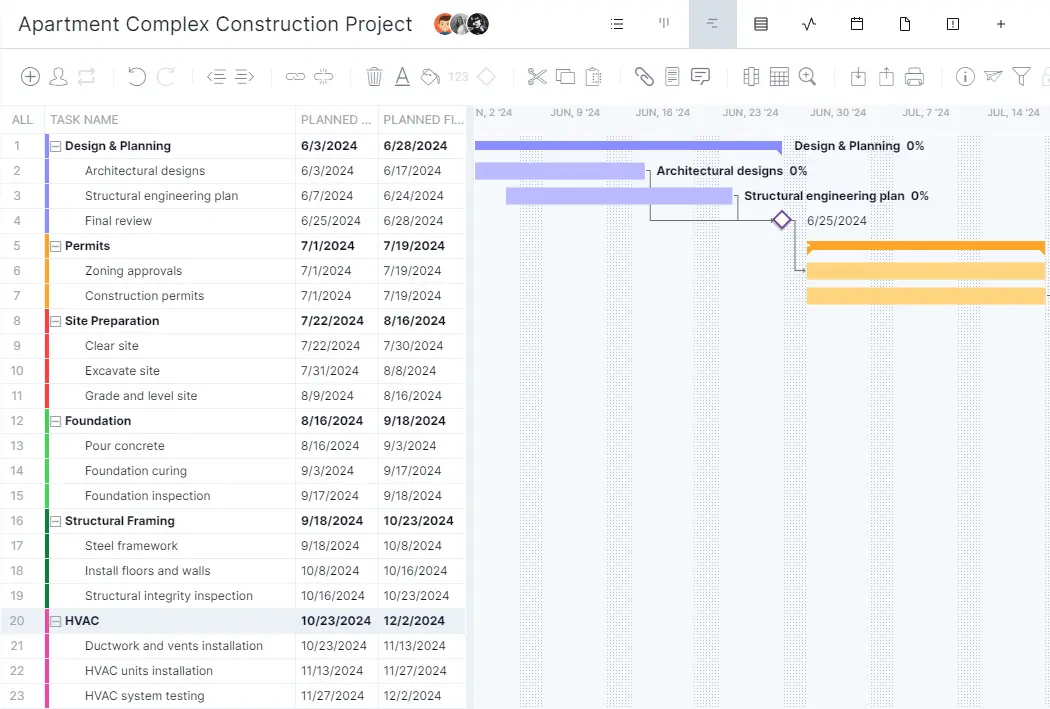
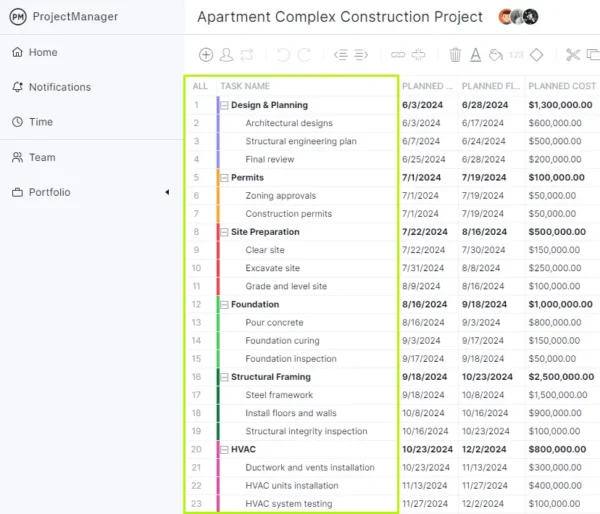
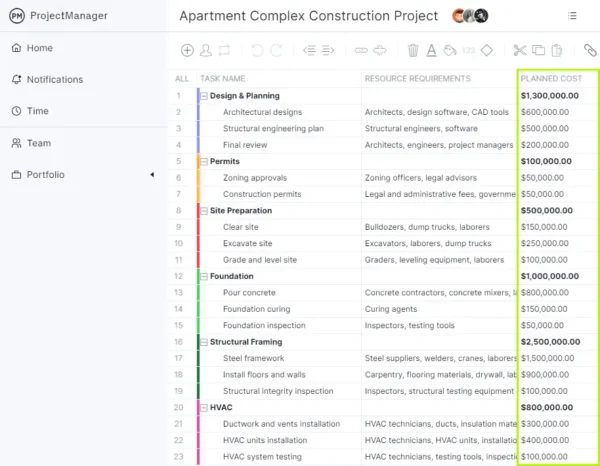
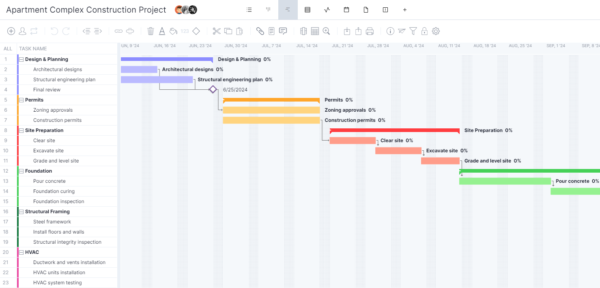
The highlighted areas on the Gantt chart show the project divided into tasks. These tasks are then broken down into subtasks. This feature can be used to identify various phases in a project. In this example, these show various project phases for the construction of an apartment complex, such as design and planning, permits, site preparation, foundation and so on. These project phases are also color-coded so it’s easier to identify them.
2. Set Due Dates
This is when you take the tasks and sequence them over your project timeline. It is possible and even likely that some tasks will be performed at the same time but by different team members.
As you determine what the start date is, your tasks will show up on the bar chart timeline at that date. Then with the knowledge you’ve acquired in the last step, make a time estimation as to when the task will be completed. This creates the two points and the bar between them, marking the time it will take to do the task throughout the entire project.
This is the first step towards creating a schedule for the project. The duration of your tasks is the time between the start date and the end date. Now you’re cooking with gas. You no longer have merely a task list, but a visual representation of your project laid out over a timeline. This provides an at-a-glance aid to your progress once you execute the project.
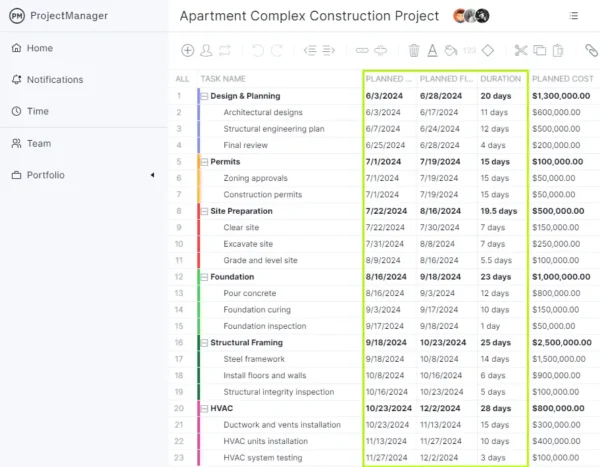
Next to each task and subtask are three columns. One is for the planned start date, the other is for the planned finish date and the third captures the estimated duration of the task.
3. Assign Project Tasks to Team Members
Once you have your tasks, milestones, durations and dependencies on your Gantt chart, you can start assigning tasks. This is where you give team members work. They are now responsible for meeting the due date of the tasks to which they are assigned.
Project managers can use the Gantt chart to create a project schedule and as a visual guide to track the team’s progress as it works through their assignments. But there’s much more a Gantt chart can do if you’re working with superior project management software.
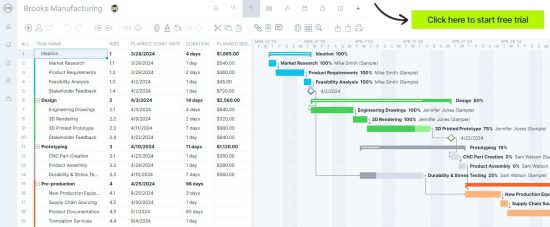
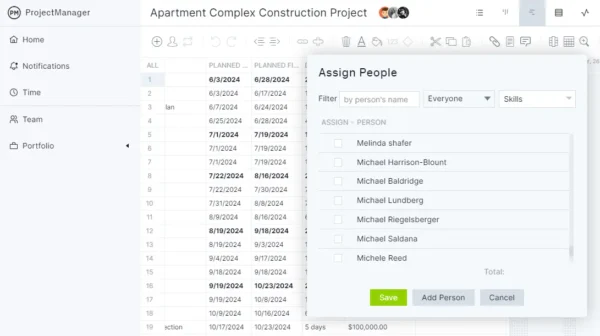
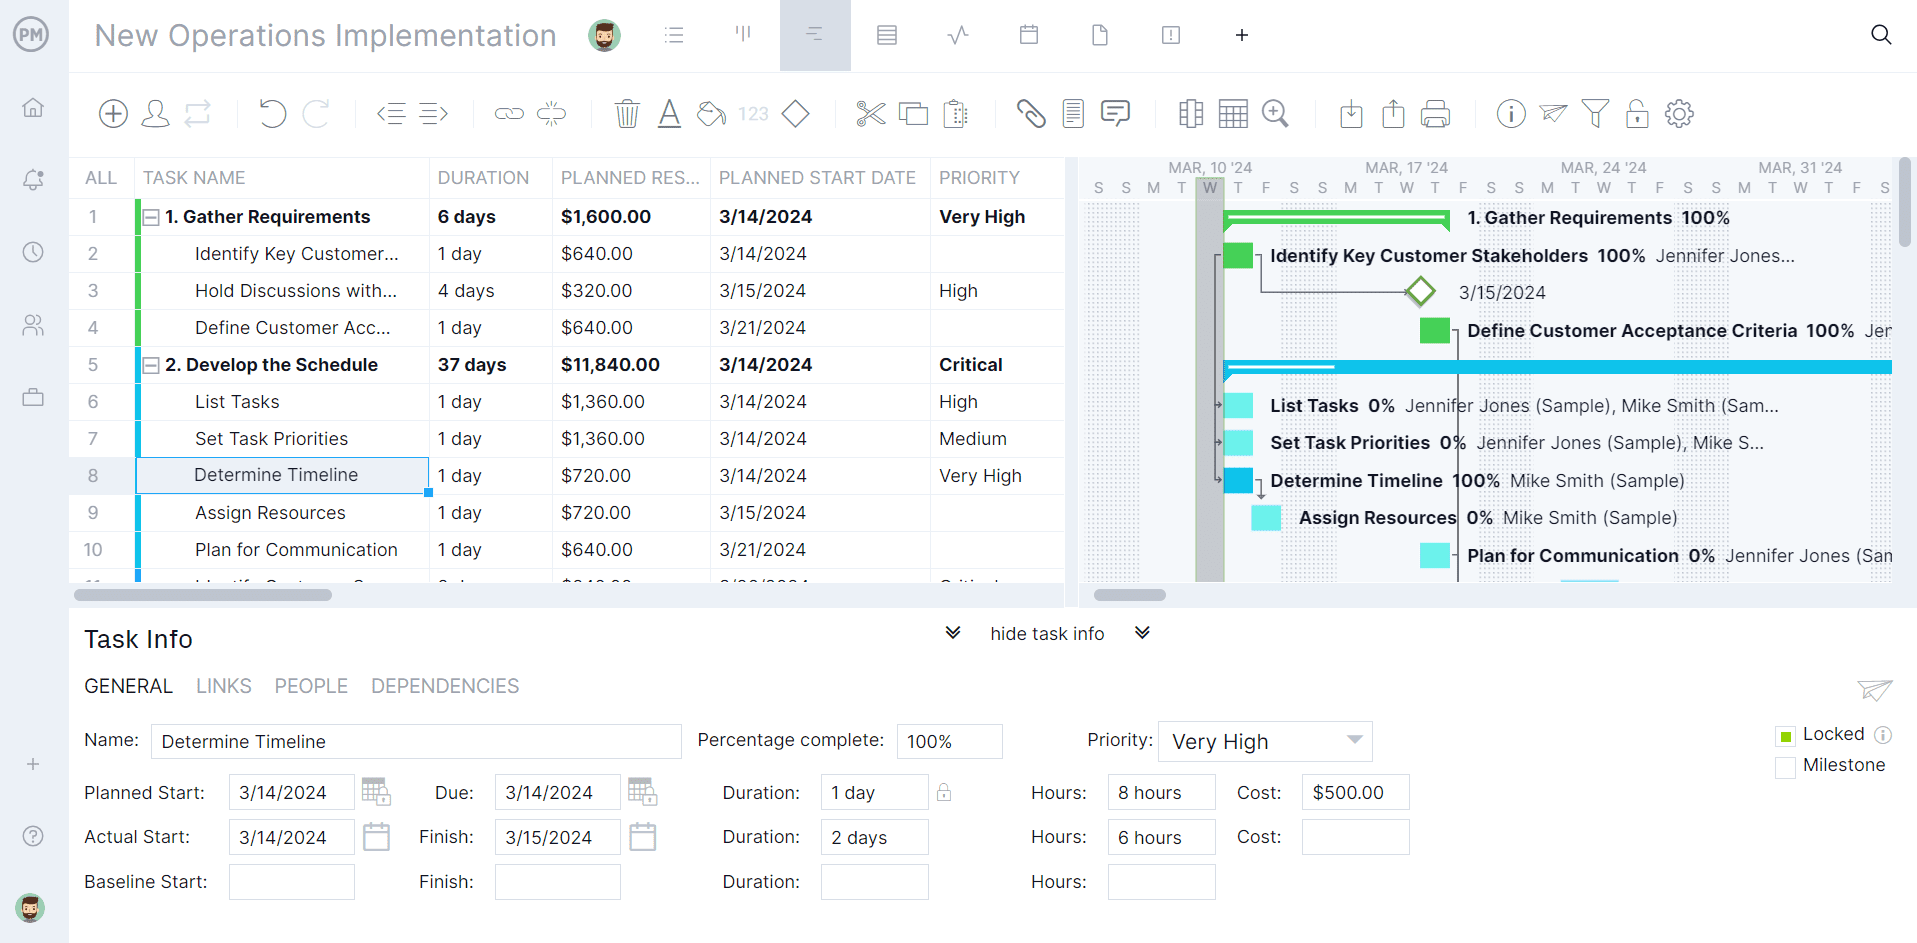
Once tasks are listed with start and end dates estimated, the next step shown below is to assign those tasks to team members. A popup menu lists the project team members and the project manager then chooses one or more to be assigned to that task depending on their availability and skill level.
4. Identify Resource Requirements
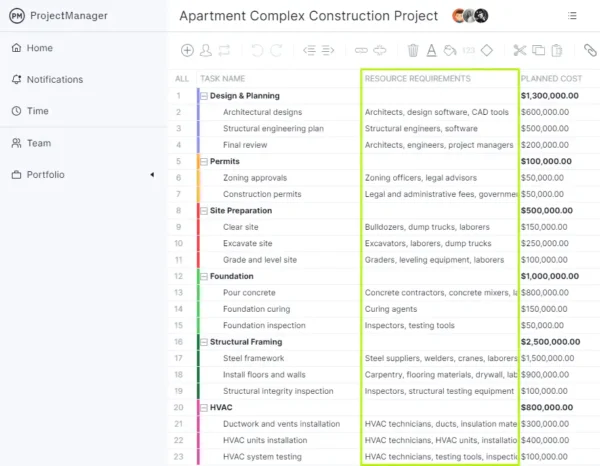
Every task requires a set of resources to execute it. At this point in the project planning phase, the project manager will list those resources. The resources are varied and can cover people, equipment, raw materials, tools, etc. In the example below, looking at the design and planning task, the associated resources collect everything from architects to design software. Whatever the resources, be sure that they are thoroughly listed. To miss an essential resource will negatively impact the schedule, resource allocation, the budget and more.
5. Estimate Project Costs
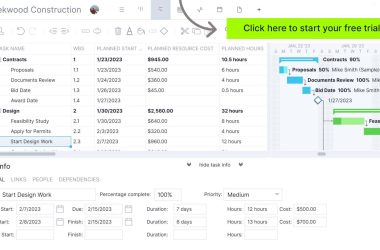
Resources cost money. Whether they’re the wages for the team members assigned to the task or the cost of procuring materials, renting equipment, etc., these costs must be accurately estimated to keep to the project’s budget. After listing the resource requirements for the project, there’s a column on the Gantt chart when those costs are forecast. The planned cost column is a critical step in both planning and budgeting the project. Each task has an estimated cost and then the associated subtasks have their own costs, all of which must not exceed the estimated cost for the task.
6. Add Milestones
Add milestones to your Gantt chart to mark the completion of your project deliverables or work phases. While you want to collect every task, no matter how tiny, you don’t want to neglect the big picture. Gantt charts allow you to break the project up into phases or mark when a large unique section of the project is complete.
Having milestones in a project is helpful. It not only boosts morale to see that you’ve finished a large chunk of the project, but it delineates key events, acting like signposts on the route to your final destination.
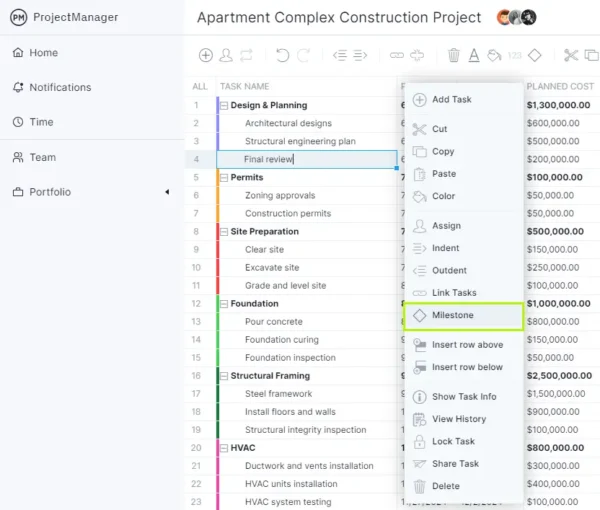
Milestones are important for several reasons. One, they break the project into manageable pieces by identifying important dates. They also help monitor progress and provide a point in the project in which the team can celebrate a win. Use this popup window to select a milestone and drop it in the appropriate place, where it will be represented by a diamond icon.
7. Identify Task Dependencies
While some tasks can be executed at the same time, others can’t be started until another has finished. These are called task dependencies. If they’re not identified, they can create bottlenecks in your team’s workflow.
There are four types of task dependencies.
- Finish to Start: Task can’t start until the one before it is finished.
- Start to Start: Task can’t start until the one before it starts.
- Finish to Finish: Task can’t end before the one before it ends.
- Start to Finish: Task can’t end before the one before it starts.
Once these task dependencies are identified, create them on your Gantt chart by linking the related tasks. That way you’ll be able to readily see which tasks are dependent on one another.
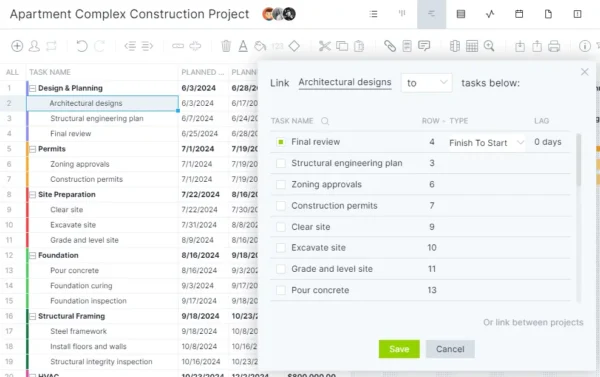
Identifying dependencies avoids delays that can set the project behind schedule and run over budget. Gantt charts should have the ability to note all four types of task dependencies. In the illustration below, a subtask is linked to the task it is dependent on and defined as finish to start.
8. Find the Critical Path
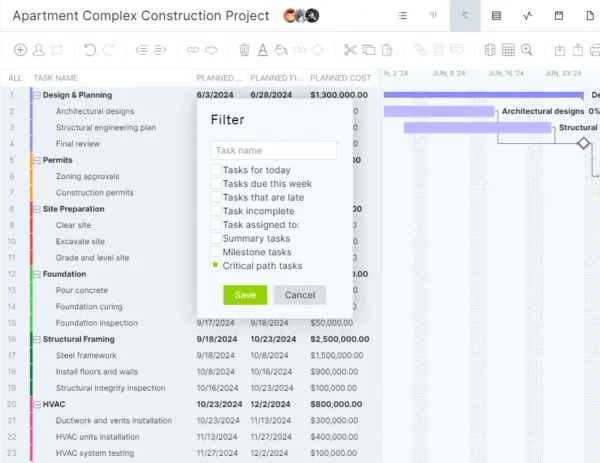
Critical path analysis identifies the sequence of tasks that determines the minimum duration required to complete a project. It’s the longest stretch of dependent activities and indicates the shortest time possible to complete the project. It’s an essential part of planning and being able to filter for the critical path is what separates good Gantt charts from great Gantt charts. In the illustration below, a popup window filters for the critical path to save the project manager from having to do those calculations by hand and identify the tasks that must be done for the project to be delivered successfully.
9. Identify Project Phases and Color-Code Them
The Gantt chart is a visual representation of the project schedule. It’s a valuable tool, but as projects grow in complexity the timeline can be difficult to read. There are ways to make it easier to view at a glance. Just as a project is made more manageable by breaking it down into smaller phases, the Gantt chart makes those phases more evident by allowing the project manager to color-code them. Here, a popup window has a menu of colors to choose from to color the Gantt chart so each phase is a distinct color. This makes the Gantt chart more comprehensible.

Follow the steps above to make a Gantt chart online using ProjectManager. Here’s how the stacked bar chart or timeline looks after color-coding project tasks.
However, there are other features and tools to discover! Read on to learn more, or if you prefer, get started with our free Gantt chart template for Excel.
Gantt Chart Template
If you’re not ready to get started with Gantt chart software such as ProjectManager, you can use this free Gantt chart template for Excel. The best part is, then you can export the data from the Excel template into ProjectManager and use its robust Gantt chart features.
Why ProjectManager Is the Best Software to Make a Gantt Chart
Whether you’ve used our Gantt chart template or merely collected a task list in an Excel or Google Sheets spreadsheet, you can take it to the next level by importing the document into the ProjectManager Gantt chart maker. You can import MS Project, CSV or Excel files and your tasks are spread out over a bar chart timeline automatically.
You can then pick and choose which columns you want on the left side of the Gantt chart tool. There, you can add start and end dates, identify subtasks and estimate the duration of each activity. Milestones are added by diamond symbols and task dependencies can be linked.
When it comes time to assign tasks to your team members, you can do so directly from our Gantt chart tool. Then team members can use the Gantt chart view as a collaborative platform when they’re executing the tasks. Because ProjectManager is online project management software, they can access it anywhere and at any time, which is great for distributed teams.
Team members can also comment at the task level, adding documents as needed. We have unlimited file storage, so they can attach whatever images or handoffs are necessary. If a team member has a question for the project manager or another project member not assigned the task, they can @ them and that person will be notified by email, so they can join the discussion.
Easy Editing & Automations
One complaint about Gantt charts is that they’re difficult to edit. But ProjectManager makes changing task durations, adding task dependencies and updating the Gantt chart as easy as drag-and-drop. Just grab your start date and end date and move it to where you want. It’s that easy.
The online Gantt chart also can be automated, so if a task is delayed, the dates of the task dependent on it will be adjusted to avoid any scheduling mistakes. Email notifications can be automated as well to keep project managers and team members updated when tasks are completed. ProjectManager fulfills the promise of Gantt charts in project management.
What Other Software Is Used to Make a Gantt Chart?
Today, project managers have access to different Gantt chart templates, Gantt chart tools and project management software. These are the most common choices.
How to Make a Gantt Chart in Microsoft Excel
You can create a basic Gantt chart with Excel spreadsheets and bar charts. If you’d like to learn more about this process, read our blog on how to make a Gantt chart in Excel.
Here are some pros and cons of using Excel to create a Gantt chart:
Pros:
- An inexpensive solution if you have a Microsoft Office license.
- Your team members are likely to be familiar with Microsoft Excel.
- There are Gantt chart Excel templates that you can use throughout the web.
Cons:
- Microsoft Excel is not a project management software, so it doesn’t have other complementary features such as time tracking, workload management, task management, etc.
- It is a static document that needs to be updated manually and lacks important features such as identifying the critical path, assigning tasks to team members, identifying task dependencies, among others.
- Every team member that wants to see the Gantt chart needs to download an Excel file, one for each update.
How to Make a Gantt Chart in Microsoft Project
Microsoft Project, or MS Project, is a project management tool that allows you to create better Gantt charts than Excel spreadsheets. However, it has limitations as well. To learn more about this process, read our blog on how to make a Gantt chart in Microsoft Project.
Pros:
- It has other project management features besides the Gantt chart maker.
- Microsoft project Gantt charts are easier to update than Excel Gantt charts.
- MS project Gantt charts have more features than Excel Gantt charts.
Cons:
- It’s an expensive and hard-to-use project management software.
- It’s not a cloud-based Gantt chart tool, so it requires you to install it on every team member’s computer.
- Doesn’t work on Mac computers.
How to Make a Gantt Chart in Google Sheets
Google Sheets Gantt charts share some of the pros and cons that we’ve discussed above. To learn more, read our blog on how to make a Gantt chart in Google Sheets.
Pros:
- It is an online tool that facilitates team collaboration and file sharing.
- It has a friendly user interface, and it’s simple to use.
- Allows you to create basic Gantt charts with its spreadsheet and bar charts.
Cons:
- Google Sheets isn’t a project management tool so it doesn’t have other complementary features such as time tracking, workload management, task management, etc.
- Just like Excel, it only allows you to create a simple Gantt chart that lacks important features such as identifying the critical path, assigning tasks to team members, identifying task dependencies, among others.
As you can see, even though these are the most common ways to create a Gantt chart, they’re not the ideal solution project managers need. ProjectManager has the right project management features that not only allow you to create Gantt charts, but also manage your projects from start to finish.
ProjectManager is online project management software. Our online Gantt chart maker gives project managers the tools to control schedule, link task dependencies and track progress with integrated reporting. Team members get a collaborative platform to work more productively. That’s just one aspect of our software, which also has kanban, calendar and list views. See how we can help you manage your next project by taking advantage of our free 30-day trial.
The post How to Make a Gantt Chart: Steps, Tools & Tips appeared first on ProjectManager.