Project managers are responsible for tasks across every part of a business. They have to schedule work, manage people, manage budgets and wrangle technology—just to name a few.
If you had to boil it down and define the core function of a project manager in just one sentence, it would be something like, “Project managers ensure work is finished on time and within budget.”
But how does a project manager know whether a project is within schedule, or falling behind? They use a powerful calculation that quantifies and measures project progress called schedule variance.
Schedule variance can be calculated manually, but it’s much more effective to use project management software so that it can update dynamically and change in real time as the project progresses. With ProjectManager, you can track planned versus actual data with Gantt charts, dashboards and reports so you never fall behind.

What Is Schedule Variance?
Schedule variance (SV) is a calculation that measures whether a project is on track by calculating actual progress against expected progress. Schedule variance allows project managers to bring data into the conversation. Instead of saying, “The project is falling behind a little bit,” one could say, “The project is 20 percent behind where it should be.”
Schedule Variance & Earned Value Management
Schedule variance is a key component of earned value management, a project management methodology that considers a project’s schedule, scope and budget. Schedule variance is a metric that measures the difference between earned value and planned value, which is usually expressed in monetary units, such as dollars. It helps project managers with progress updates.
Project managers can use schedule variance to identify trends and make decisions to keep projects on track. For example, schedule variance can be used to determine how many resources remain and how to best use them. Schedule variance can also be used to communicate with team members and promote positive feedback.
Get your free
Project Timeline Template
Use this free Project Timeline Template for Excel to manage your projects better.
How to Calculate Schedule Variance
To calculate schedule variance, it’s necessary to first calculate two important earned value management (EVM) metrics, the budgeted cost of work scheduled (BCWS) and the budgeted cost of work performed (BCWP). These will then be used in the schedule variance formula.
Budgeted Cost of Work Scheduled (BCWS)
Budgeted cost of work scheduled (BCWS), also known as planned value (PV), is the cost of the work that’s expected to have been completed by a specific point in time within a project.
It helps project managers compare planned progress against actual progress in terms of cost. BCWS is crucial in earned value management (EVM) as it allows for the calculation of schedule variance (SV) and schedule performance index (SPI), another EVM project metric used to determine how well a project team is keeping up with the project schedule.
By monitoring BCWS, project managers can identify schedule deviations early and take corrective actions such as reallocating resources to ensure the project stays on track. To calculate the BCWP simply follow these steps:
- Identify the Budget at Completion (BAC): A term used in EVM to refer to the total budget allocated for the completion of a project.
- Break down the project scope into tasks: The scope of a project refers to the work to be done, it should be broken down into individual tasks or action items. A work breakdown structure can help with this process.
- Estimate Resource Requirements and Costs: Once project tasks are clearly identified, then project managers can begin to plan what resources will be needed and then estimate their costs.
- Calculate the BCWS: Based on an estimation of the project task costs, the project management team can determine the BCWS for any date in the project schedule by adding up the costs of the tasks that should have been completed by then.
Budgeted Cost of Work Performed (BCWP)
Budgeted Cost of Work Performed (BCWP), commonly referred to as Earned Value (EV), is a metric that indicates the cost of the work that has already been completed.
By comparing BCWP against BCWS and the Actual Cost of Work Performed (ACWP), project management teams can measure whether they have performed the work that was planned to be completed as planned in the project budget and project schedule.
To calculate BCWP, follow the same process explained to calculate BCWS and simply add the actual costs of the tasks that have been performed to date in a project.
Schedule Variance Formula
To calculate schedule variance, subtract the Budgeted Cost of Work Scheduled (BCWS) from the Budgeted Cost of Work Performed (BCWP). All values used will be a monetary figure (USD, GBP, etc.). Here’s the formula:
BCWP – BCWS = SV
Sometimes you will see this formula as EV – PV, but it means the same thing: EV (Earned Value) – PV (Planned Value) = SV
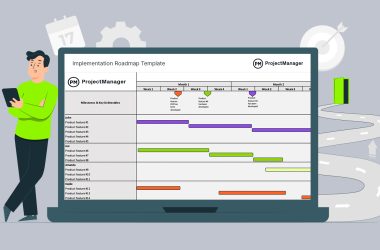
Related: Project Scheduling Templates
Schedule Variance Example
To help you fully understand this calculation, let’s use an example scenario and plug in the numbers. Let’s say you’re managing a project that will last 20 days and the total project budget is $100,000.
In this example, you are 10 days (or 50%) into the project, so you should have completed $50,000 (50% of total budget) worth of work by this point. But, unfortunately, you’ve only finished $25,000 of work.
Here is what it looks like when you plug the numbers into our schedule variance formula:
BCWP ($25,000) – BCWS ($50,000) = SV (-$25,000)
Then, to express schedule variance as a percentage, simply divide:
SV (-$25,000) / BCWS ($50,000) = -.5 or -50%
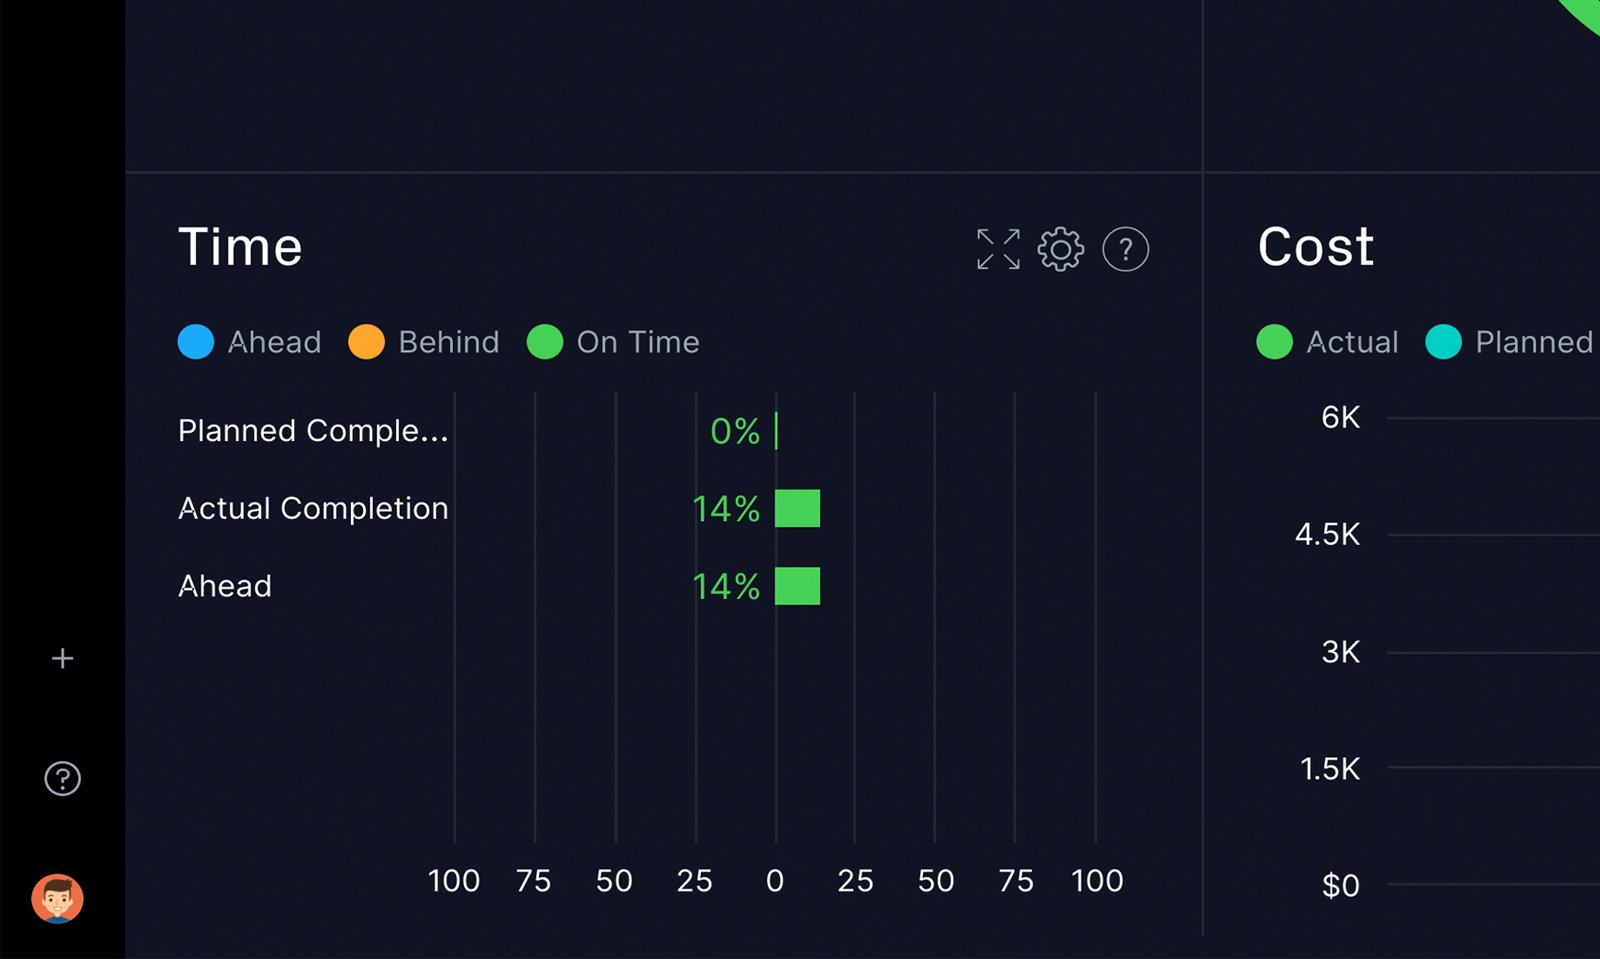
This figure tells you that your project is 50% behind where it should be at this time. If the resulting number is positive, then your project is ahead of schedule. If the schedule variance comes out as zero, then the project is exactly where it should be!
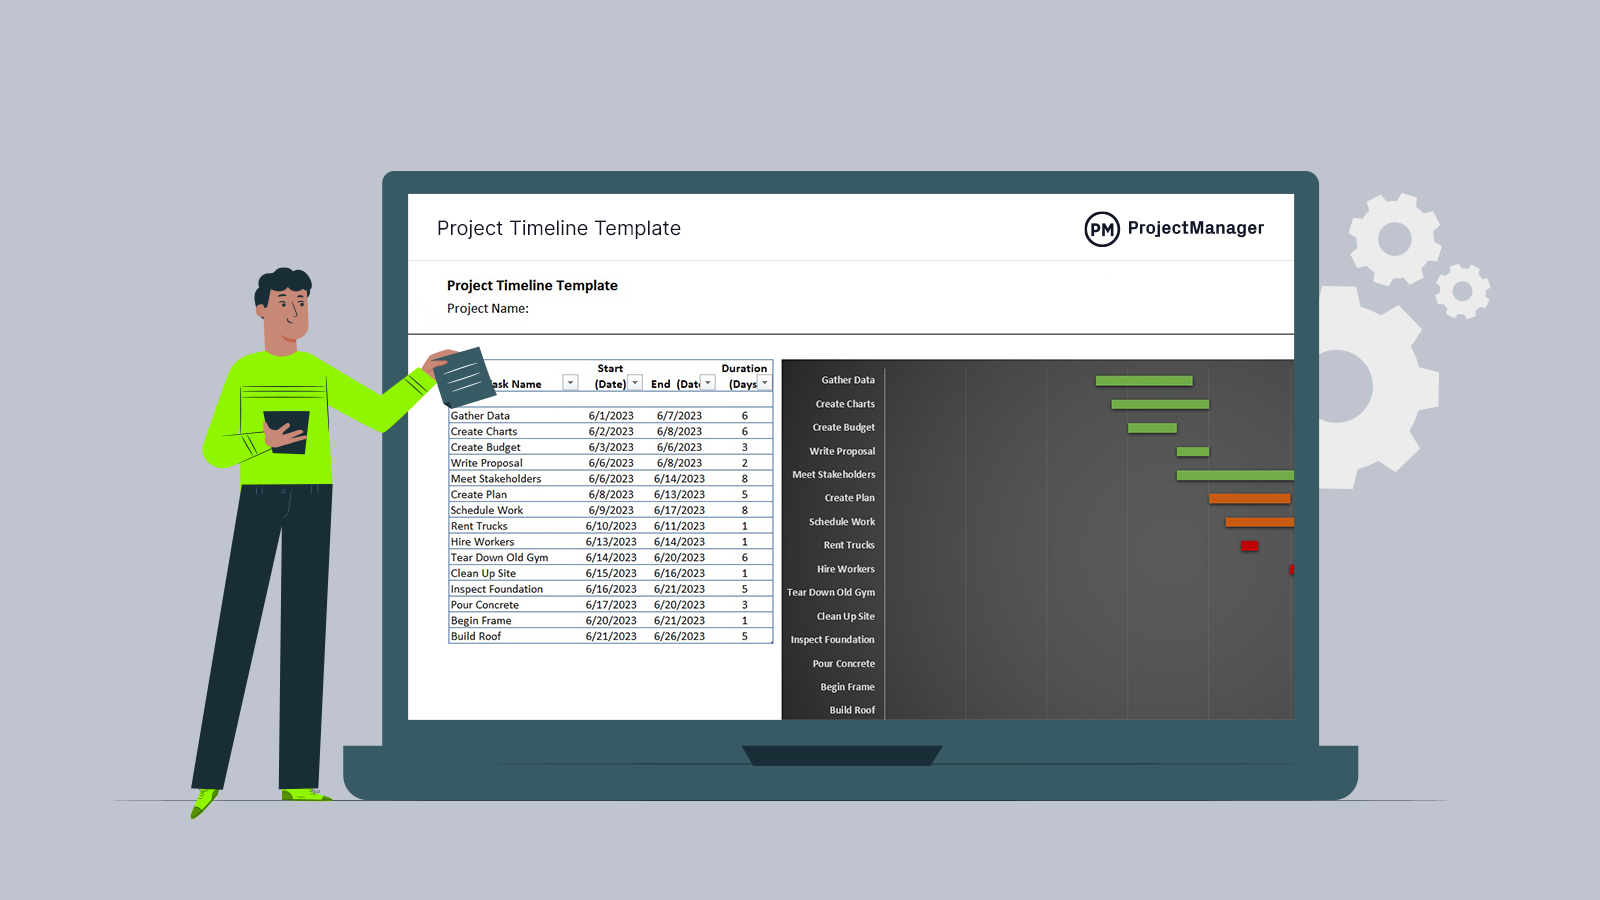
Project Timeline Template
Before being able to measure schedule variance, one must first build a project schedule. Get a head start on that by downloading the free project timeline template for Excel.
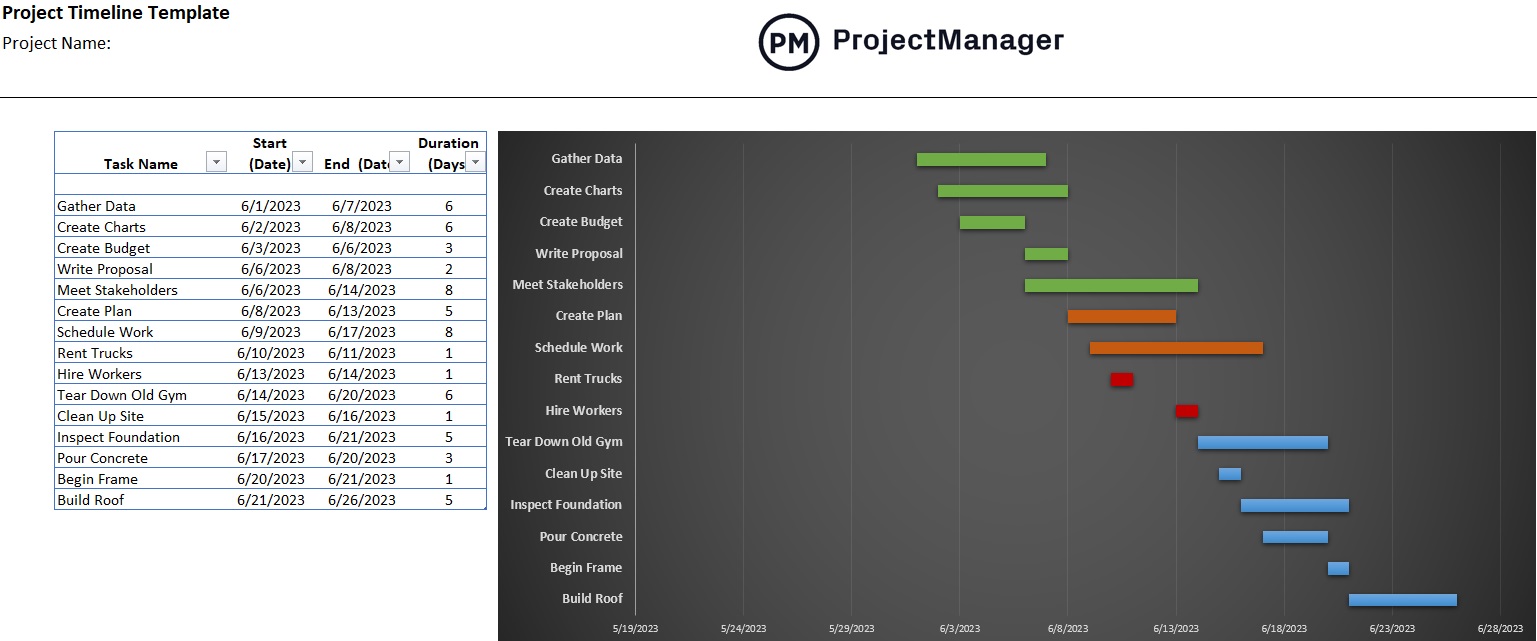
Add tasks, dues dates and milestones on this free template when planning a project. Once all that data has been added to the spreadsheet a timeline to the right will automatically be populated, showing the entire project.
Schedule Variance vs. Project Variance
Variance is simply the difference between a data set. Therefore, as we’ve noted above, schedule variance is the gap between the planned progress and the actual project’s progress. Project variance is broader, in that it includes schedule variance, but also cost variance, scope variance and quality variance.
Schedule Variance vs. Schedule Performance Index (SPI)
Schedule variance and schedule performance are related, but they focus on different aspects of the project. We’ve explored schedule variance, but schedule performance index is broader in scope. It encompasses metrics and indicators to assess how well the project is adhering to its schedule. This provides a more comprehensive view of how the project is progressing relative to its schedule.
Importance of Schedule Variance in Project Management
Knowing whether a project is ahead or behind schedule and over or under budget is a core responsibility of a project manager. Project managers are trusted by their teams and by their companies to stay in control of projects because of the following reasons:
- Project delivery affects the bottom line. If a project is late, clients and internal stakeholders stand to lose financially. When this happens, it threatens the reputation of the company—which can lead to future losses!
- Disorganization affects internal teams. If projects slide off the rails and delays happen often, teams are likely to lose morale and motivation. Teams are the happiest when their hard work pays off at the end of a project. However, when a project stalls or never seems to finish, team members begin to lose faith.
More Free Project Scheduling Templates
While project management software is a superior tool for project scheduling, for those who are not ready to upgrade there are over 100 free project management templates for Excel and Word on our site. They cover all phases of managing projects across multiple industries. Here are just a few that relate to project scheduling.
Work Schedule Template
A major part of scheduling projects is having the right team member assigned to the right task at the right time. This free work schedule template for Excel lists all employees and their tasks and schedules their work weekly or monthly.
Critical Path Template
The critical path is the longest sequence of tasks needed to complete a project. Find the critical path when scheduling a project by downloading the free critical path template for Excel.
PERT Chart Template
PERT stands for program evaluation review technique and a PERT chart is used to schedule, organize and coordinate project tasks. Use this free PERT chart template for Excel to estimate the minimum time needed to complete a project.
Using A Project Management Dashboard To Calculate SV
Although the calculation is simple, it can rapidly become a tedious task to crunch the numbers by hand, considering the calculations should be re-crunched every day as the project changes.
On large projects, keeping track of thousands of data points becomes impossible. That’s why savvy project managers choose to use a project dashboard to run their calculations, saving valuable time and resources.
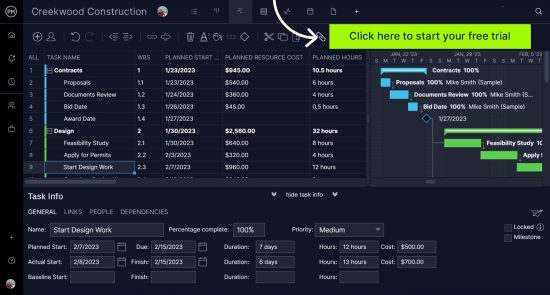
ProjectManager Dashboards for Schedule Variance
ProjectManager’s software was designed by professional project managers after they noticed a need for better tools on their projects. When managing any project, particularly large ones, a PM’s time is best spent moving work forward—not running equations all day.
Our project dashboards are built to give you real-time information about tasks, teams, and budgets. Here’s how they work.
Enter Resources and Budgets
When you build a new project, start by adding your total project budget. This number will act as a reference point as the work progresses, and graphs will be generated that allow you to quickly see if the project is within budget or at risk of going over.
Additionally, you will add two types of resources to your new project: people and things. People are internal team members and outside contractors who will be working on the project. Things are other resources that have costs like room rentals, equipment and travel.
Data Rolls Up Automatically
When you set a cost rate for each person, and that person logs time on their tasks, the software will automatically organize the data in the dashboard. The same goes for non-human resource costs—the data rolls up into the dashboard for easy viewing.
This information can be used to see, in real time, whether a project’s schedule and its budget are over or under target. Schedule variance is automatically calculated.
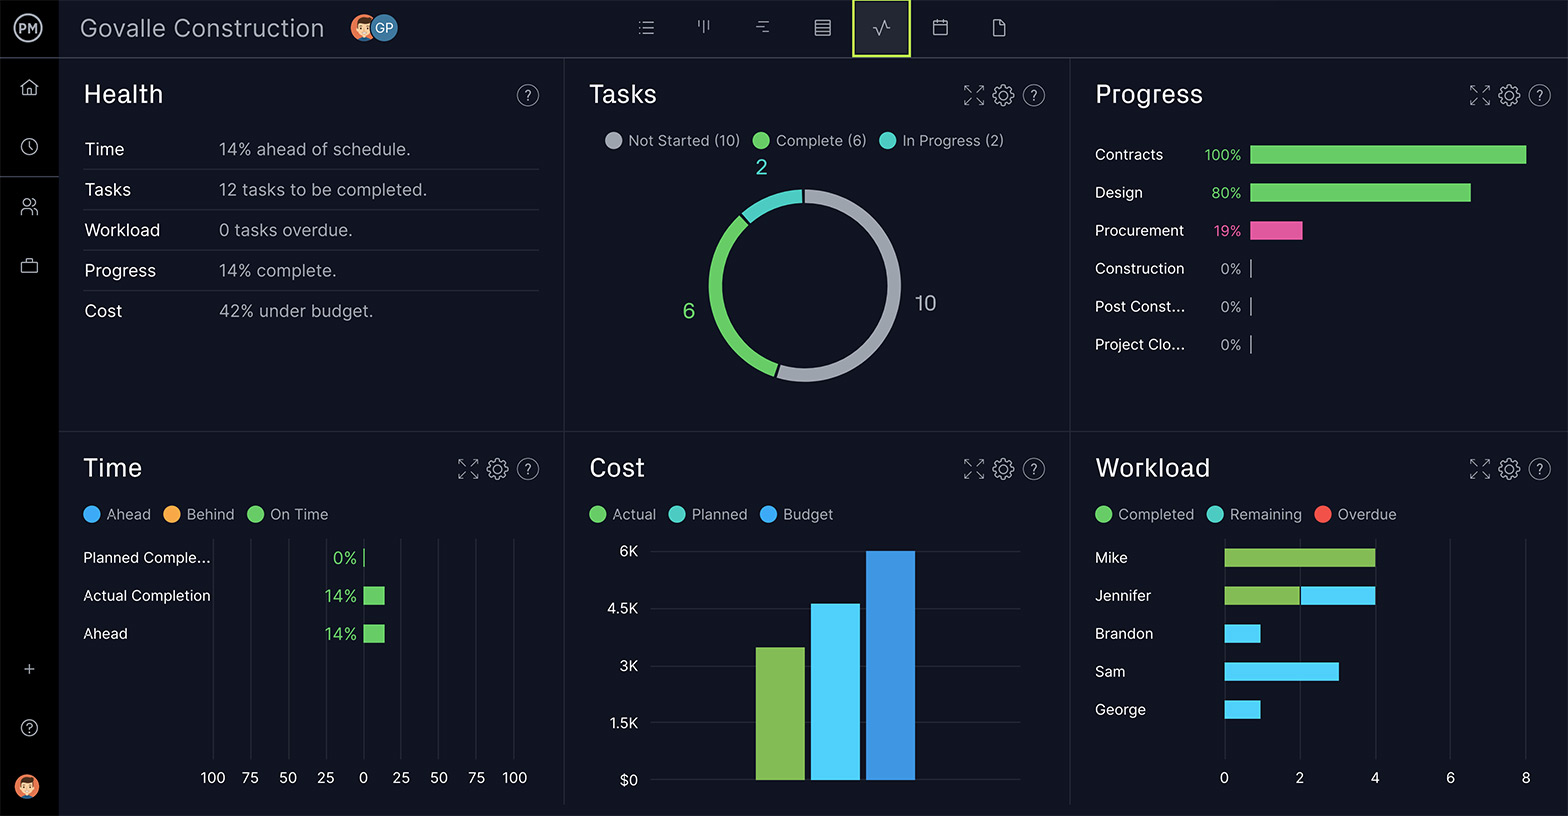
A Closer Look at the Dashboards
Schedule variance is just one of the metrics that will be automatically calculated for you. In addition to variance, you also will see graphs for
- Health: An overview of the pacing and progress of all project work
- Tasks: A breakdown of which tasks are started, completed, or yet to be worked
- Progress: A zoomed-in look at the progress of each task, to see where each piece of work is at
- Time: A look at planned vs. actual project completion
- Workload: A visual representation of each team member’s workload and availability
ProjectManager Is the Best Scheduling Software
The project dashboard is just one small piece of the software suite offered by ProjectManager. The software is used by thousands of teams and companies including NASA, Volvo and Bank of America for project planning, collaboration, monitoring and reporting.
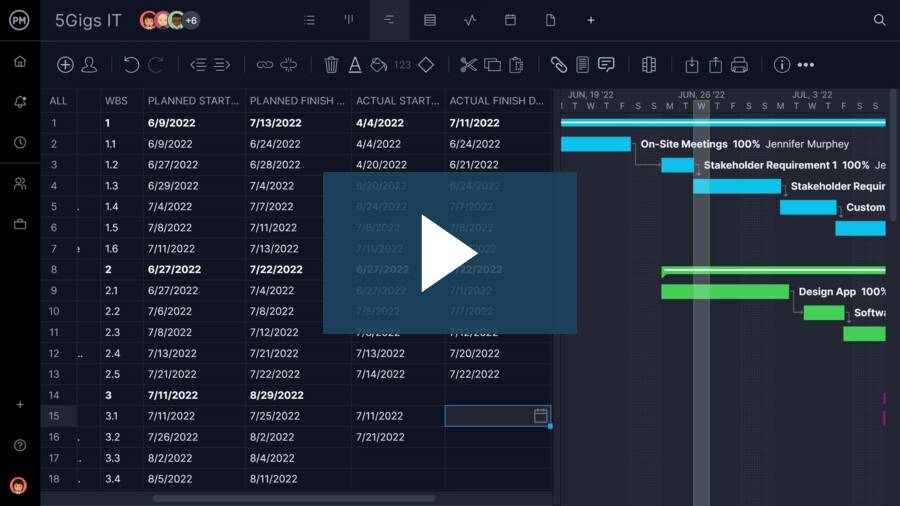
Our powerful Gantt charts enable users to plan projects of any size. Enter tasks with start and due dates and they are plotted out on a visual timeline, making it easy to see the whole project at a glance.
But that’s only a small part of how our tool helps you manage your project schedule. For a brief overview, take a look at this short tutorial video.
Team members also love ProjectManager because it makes work management simple. They can see the work that needs to be done in task lists, kanban boards and calendars.
To see ProjectManager’s software in action, and calculate your project’s schedule variance, take a free 30-day trial. For 30 days you’ll be able to use all of the powerful project management tools we offer, at no cost to you. Get planning, monitoring, reporting and collaboration all in one software suite. Click here to start your free trial today!
The post Schedule Variance: What Is It & How Do I Calculate It? appeared first on ProjectManager.