We often hear from people that building an opportunity solution tree is hard work. And perhaps one of the most challenging parts of building opportunity solution trees is defining the outcome that you put at the top.
One of the most challenging parts of building opportunity solution trees is defining the outcome that you put at the top. – Tweet This
As a quick reminder, your outcome should be something the product team is able to directly influence, but it also needs to connect to a business outcome like growing revenue.
Even in the best circumstances, it can be tough to find an outcome that meets these criteria. And when you add other limiting factors, like having a small number of users or a long sales cycle, arriving at a good outcome is even trickier.
For today’s Product in Practice, we caught up with Thomas Groendal to learn how he worked within several constraints to get closer to a meaningful outcome for his product. It’s a tale with a couple of twists and turns, so you might want to buckle up for this one!
Do you have a Product in Practice you’d like to share? You can submit your story here.
A Brief Introduction to Thomas’s Work: What Is Intelligence Analytics and the Dark Web?
Thomas Groendal is the Senior Product Manager at Bluestone Analytics, a subsidiary of CACI, a $6 billion company that focuses on intelligence analysis. What exactly is intelligence analysis? Thomas describes it as the type of work someone might do to serve law enforcement or national security objectives—think trying to identify the whereabouts of a terrorist or stopping the flow of illegal drugs in a specific location.
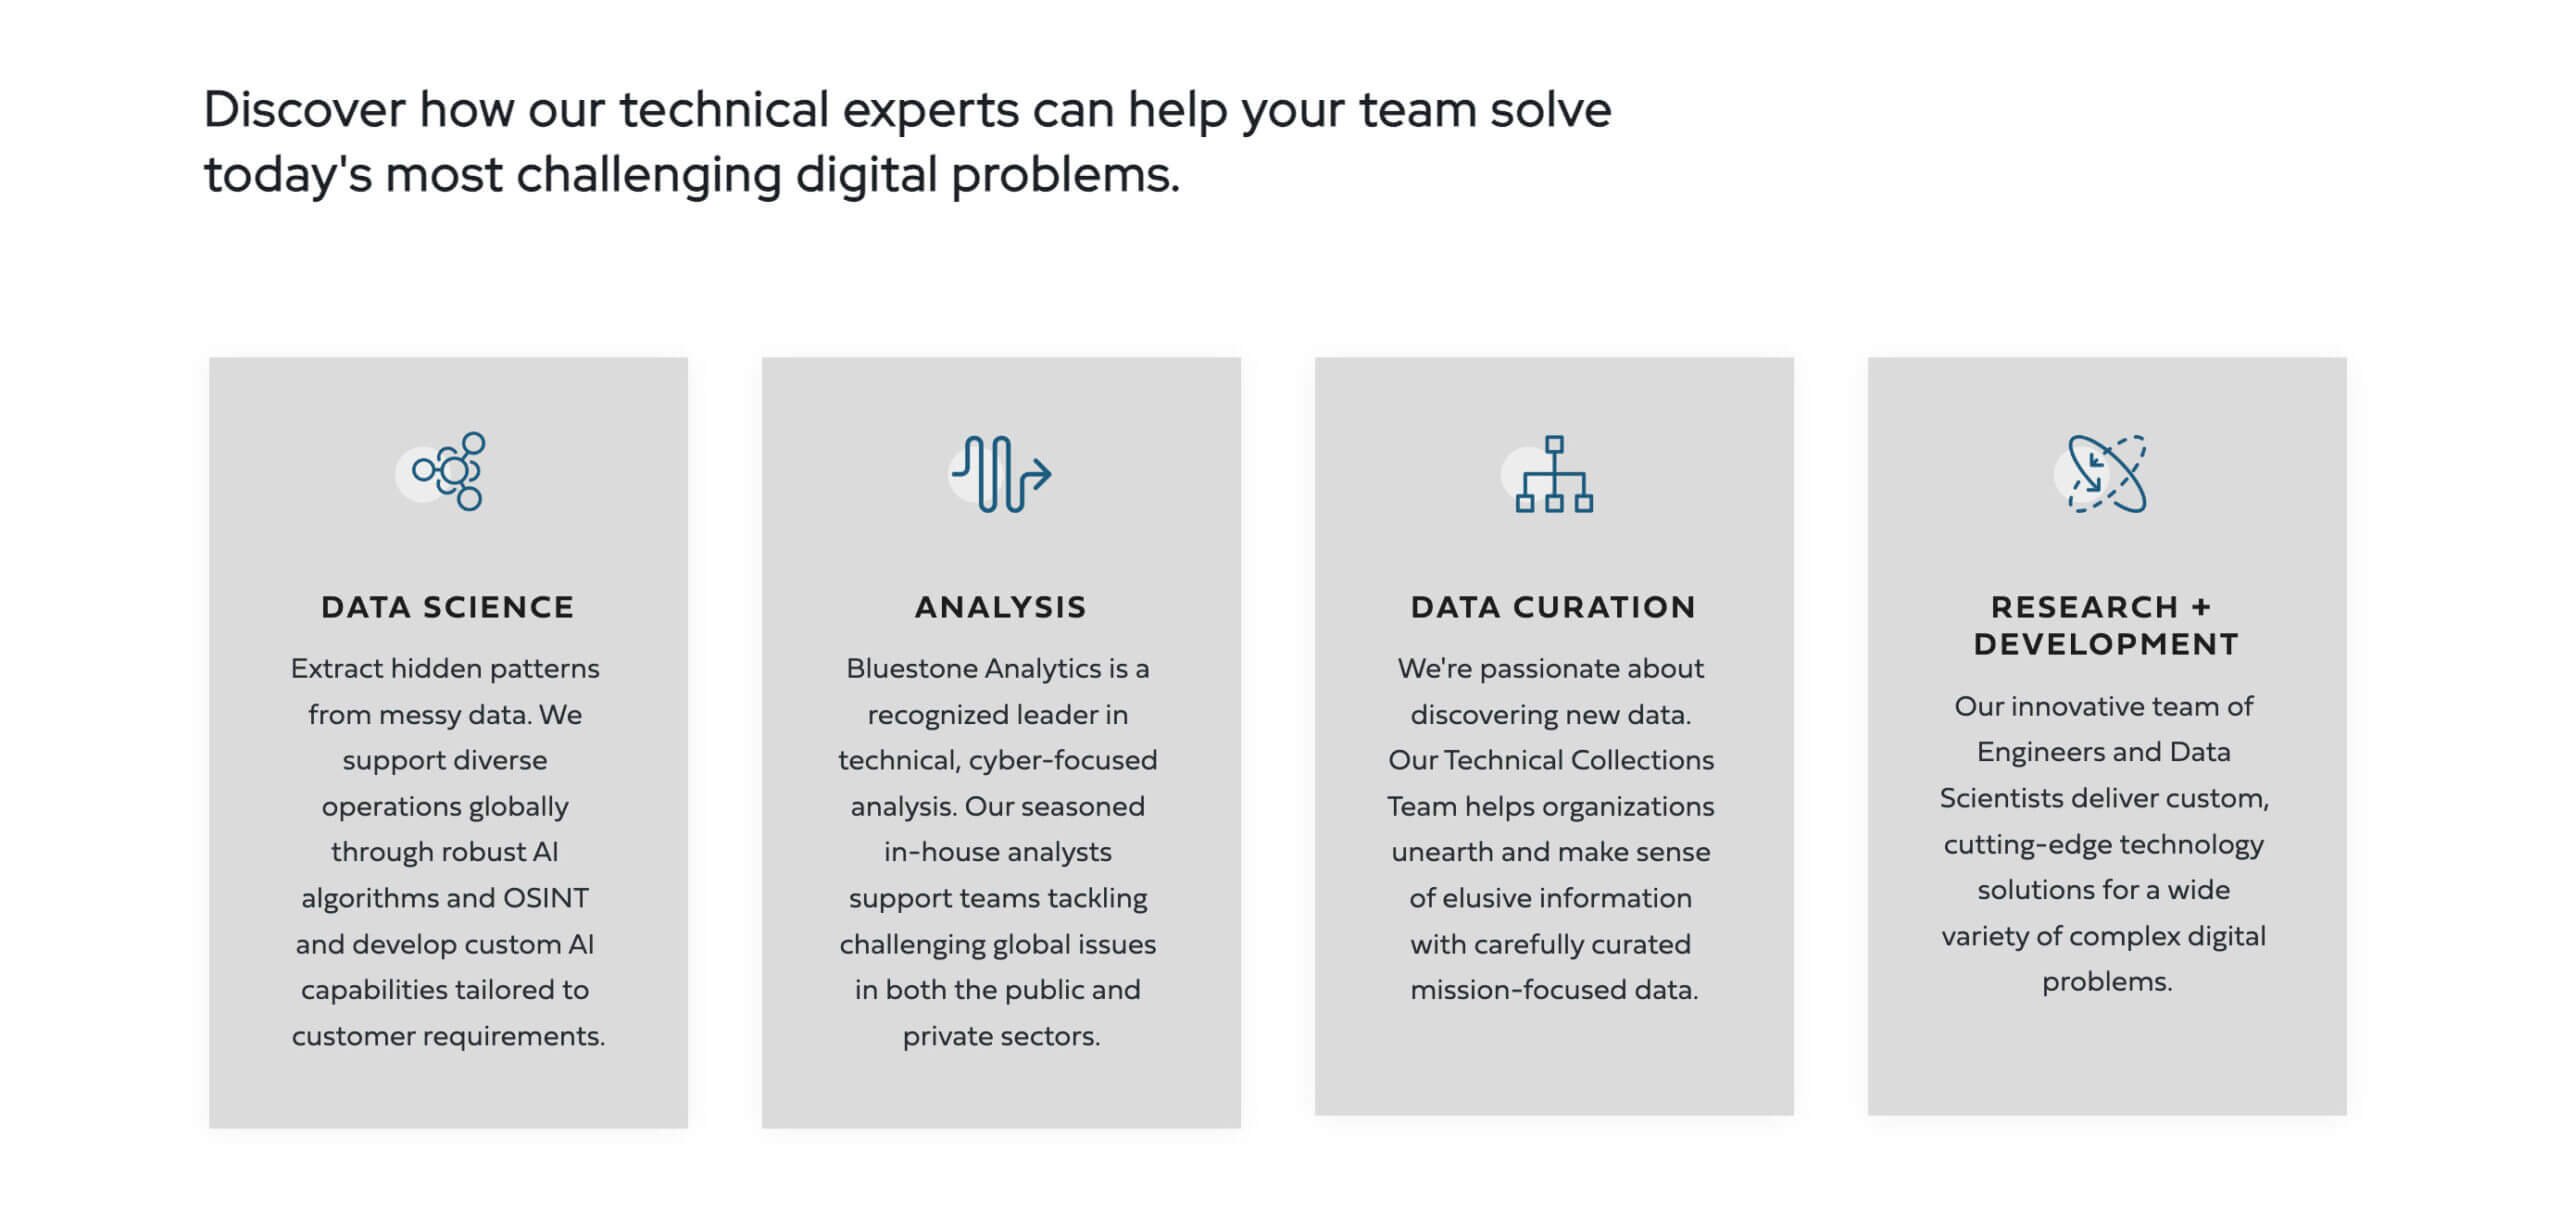
Bluestone Analytics, where Thomas works, offers a range of solutions related to data and analysis. Click the image to see a larger version.
Bluestone Analytics in particular has two main products, DarkBlue and DarkPursuit. DarkBlue takes activities that were collected from the dark web and makes them safe to view and analyze while DarkPursuit is a browsing platform that allows users to browse the dark web with a layer of anonymity and safety.
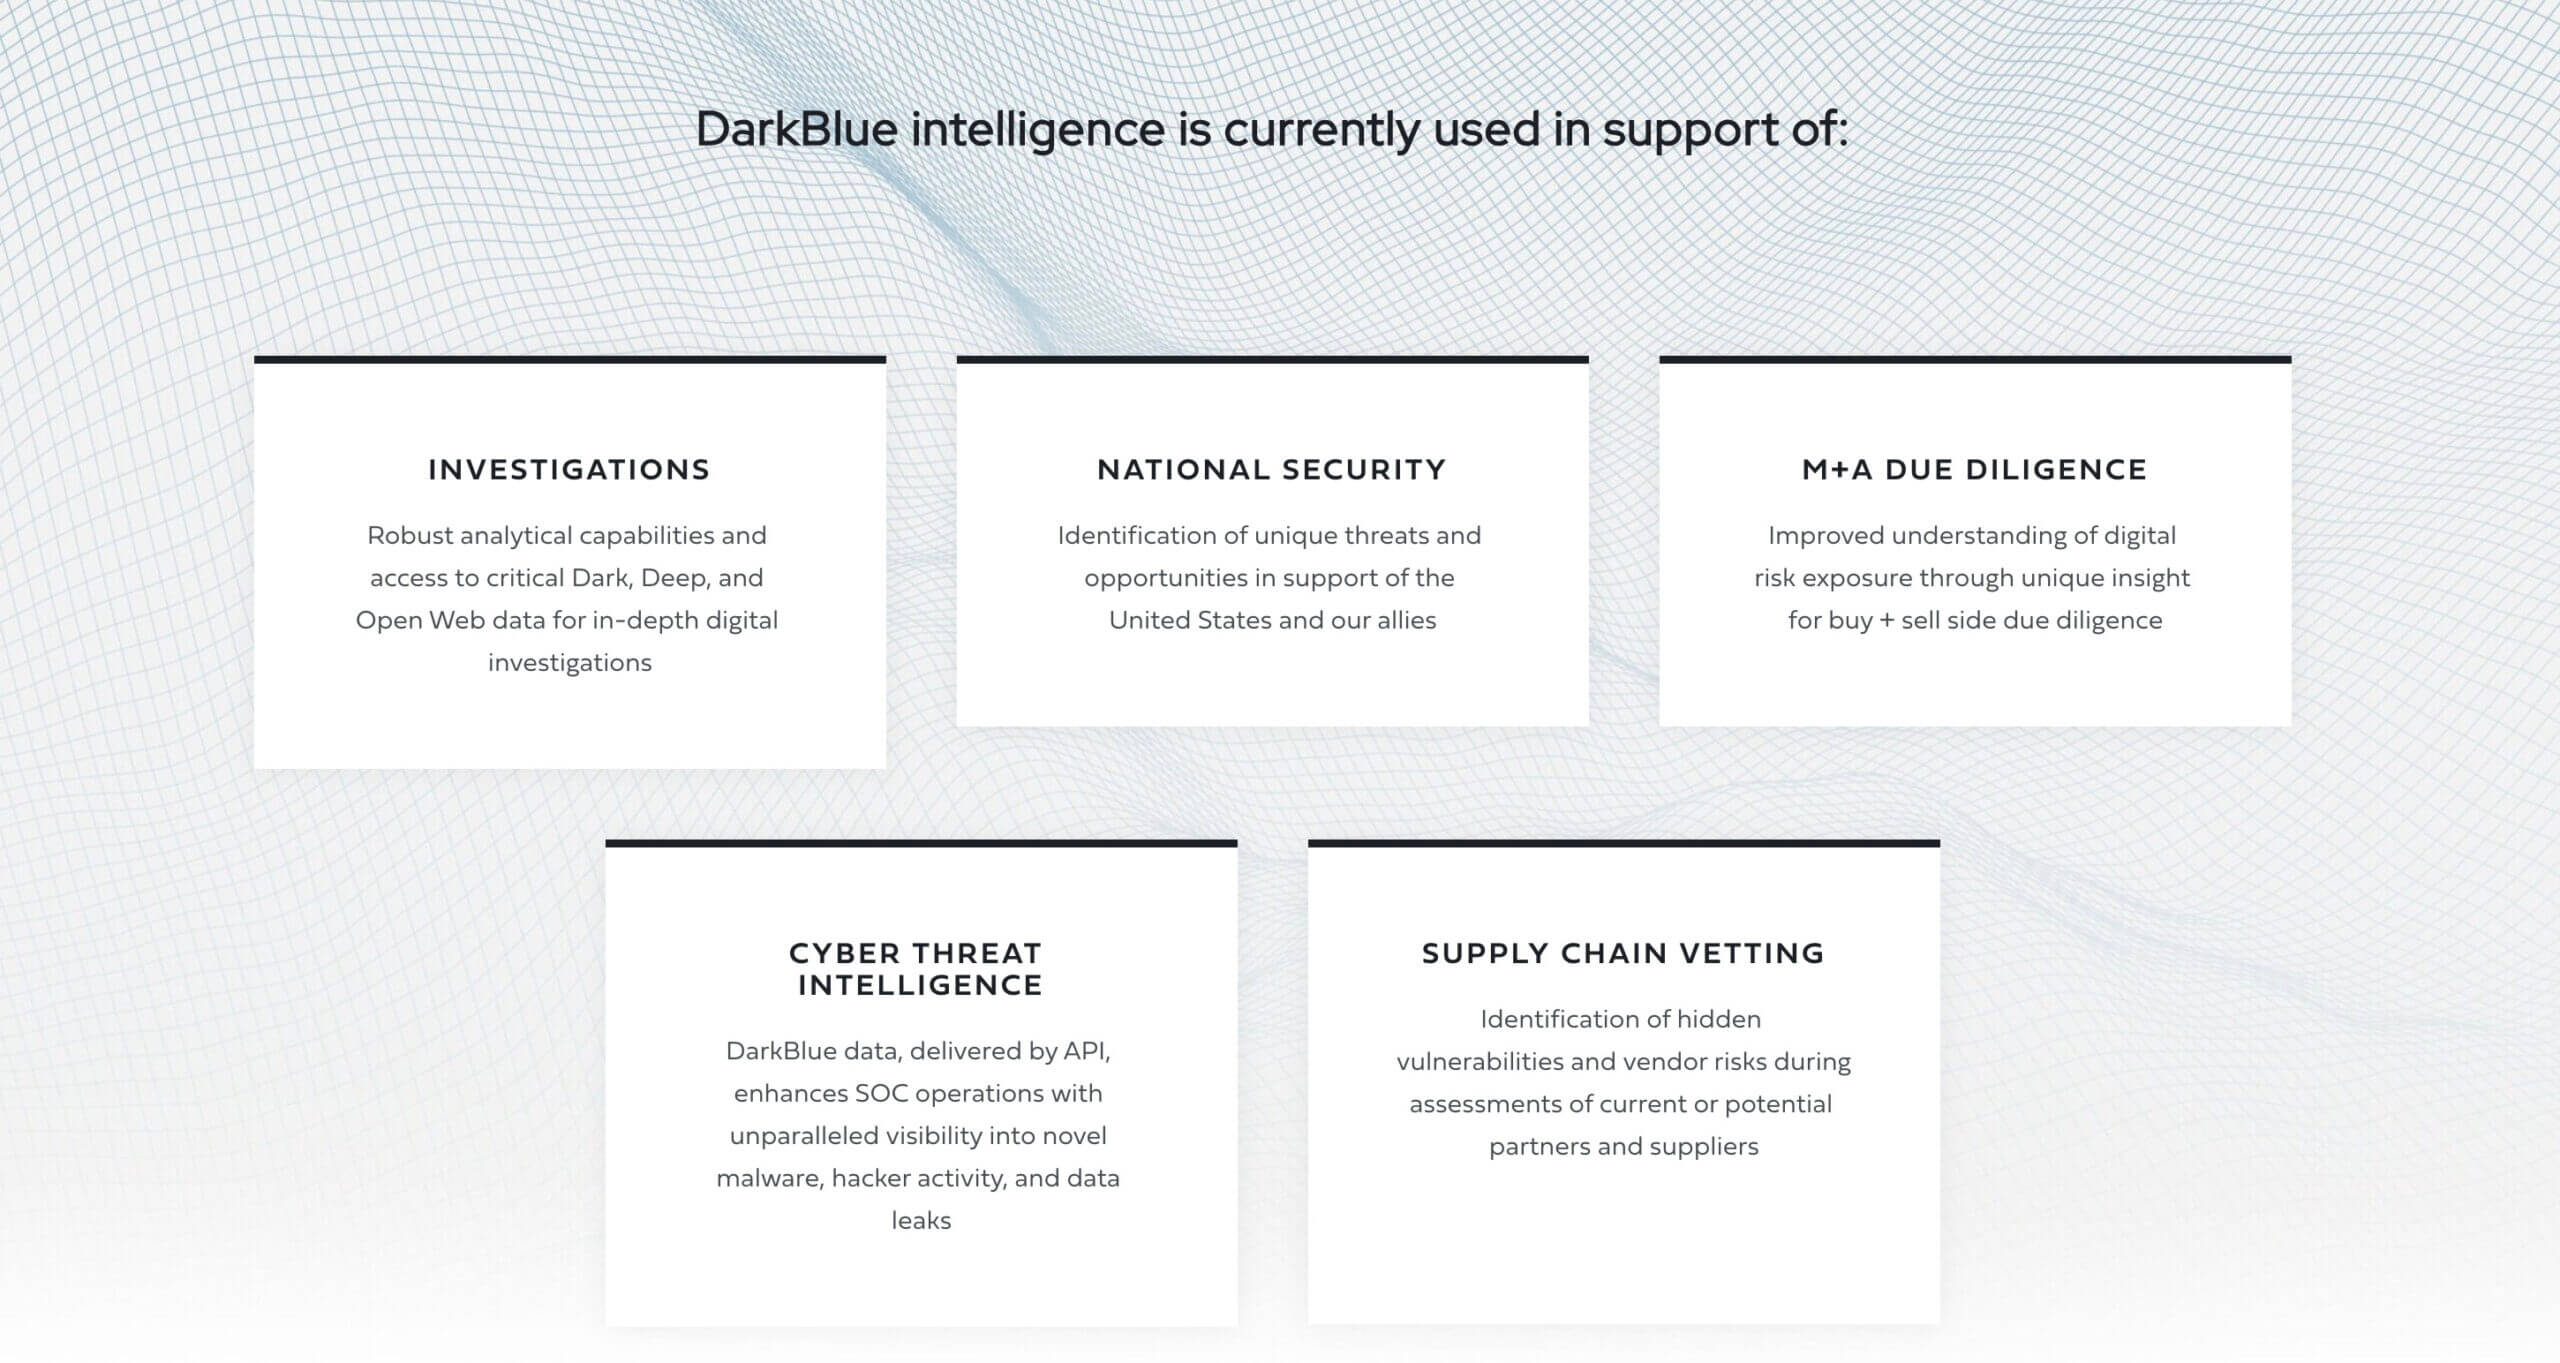
DarkBlue intelligence, the product Thomas works on, can support activities like investigations, due diligence, and cyber threat intelligence. Click the image to see a larger version.
While we’re on that topic, what is the dark web? “If by using a certain browser that connects you through a series of different randomly selected computers, you can totally obfuscate your IP address and make it impossible for somebody to truly identify who you are, then it’s a dark web,” explains Thomas. The dark web is built to protect users’ anonymity in ways that are hard to break.
Because the dark web can be a hazardous environment (both psychologically and from a security standpoint), Bluestone Analytics provides their tool suite to law enforcement, the defense department, and the intelligence community at large to help them make their investigations easier and safer.
Describing the product he’s responsible for, Thomas says, “My product squad owns presenting that data in a way that will make it easier for you to find the clues you’re looking for. We’re really about maximizing the signal to noise ratio. And my counterpart product manager’s squad is about maximizing the volume of data.”
To drill down into a specific example, if an investigator came across a dark website called “Bob’s Fentanyl Emporium,” there may be technical information that Bluestone Analytics had collected from a previous iteration of the site, such as the email address that was used to set it up. This would be the type of clue that allows an investigator to get a subpoena, gain access to someone’s computer, and potentially figure out who their suppliers are.
Thomas’s Challenge: Defining an Outcome for an Atypical Product
When Thomas joined Bluestone Analytics, they didn’t have much instrumentation. And as you might guess from the nature of Thomas’s product, there were some restrictions on how he could go about measuring user activity or instrumenting the product.
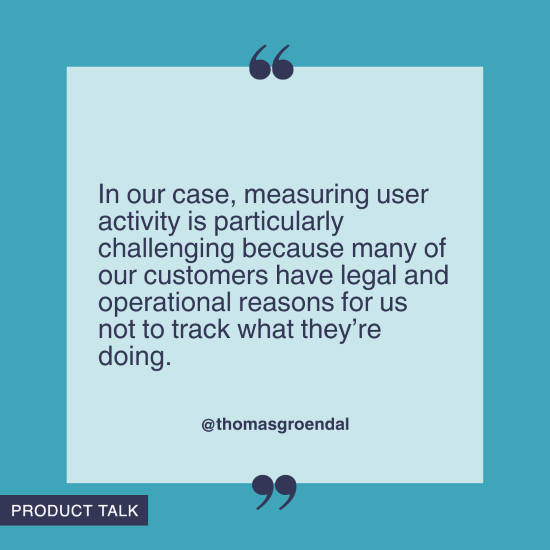
“It’s not like most apps where it’s not even a consideration—of course Slack knows whether I sent messages and it probably knows who I sent messages to,” says Thomas. “But in our case, it’s particularly challenging because many of our customers have legal and operational reasons for us not to track what they’re searching or doing.”
In our case, measuring user activity is particularly challenging because many of our customers have legal and operational reasons for us not to track what they’re doing. – Tweet This
Plus, the product doesn’t have a large number of users. “It’s a low information, high noise environment,” says Thomas.
These restrictions meant it was hard to know where to start. Thomas continues, “It took us a long time to figure out the right ways to abstract the identity of a user away from their activities, but still be able to figure out what activities in the application were going to be indicative or predictive of whether a demo customer buys.”
Getting Started: Going from Zero Information to Some Information
Thomas knew it was important to define an outcome for his team, but he also needed some information to get started. When he joined Bluestone Analytics, he described the situation as a “zero information phase.” The team’s goal at that stage was just to find any kind of metric they could collect, given the constraints mentioned above.
They started with a simple customer satisfaction rating, asking people to rate how helpful the tool was. But this wasn’t particularly useful since no one clicked on it or rated the tool.
They also tracked what Thomas refers to as “blunt measures”—things like the numbers of users logging in or not.
At this stage, Thomas says the information they had was mostly anecdotal and qualitative. He knew that they’d need to find some way to get more quantitative information. The question was how to achieve this.
Early Phases: Gathering More Information About User Behavior and Identifying a Few Potential Outcomes
In the next phase, Bluestone Analytics began working with Amplitude to instrument their product. The team began with a set of assumptions about user behavior and through conversations with customers and the Amplitude team, the team began to narrow in on a few outcomes that might be worth measuring.
Here’s how Thomas describes what he imagined as the ideal user journey: Someone comes into the app, they look at what people are talking about on the dark web, and they find someone who looks interesting and exciting. In that case, they’ll pin, save, export, or share something they’ve found. Within the product, they called this activity “clue captures.” Thomas says clue captures are what he believed customers probably cared about, based on a combination of what he’d learned from customer interviews and common sense or intuition.
But as we mentioned earlier, Bluestone Analytics’ tools have a small number of users. DarkBlue is also not the type of tool you use every day. Thomas compares it to TurboTax—it’s a tool that serves a very specific purpose, but people don’t tend to log in unless they have that particular need to fill.
While clue captures seemed like a strong contender for an outcome to measure, the team was concerned that because they don’t get much signal, it’s a slow way to measure whether the features they’re building are succeeding.
Through conversations with the Amplitude team, they learned that one user behavior they could track was any time a user hit “Control C” or used the in-app copy button. Thomas had some hesitations about defining these “copy events” as an outcome because it felt like too much of a blunt-force object or a traction metric. But at the same time, using the copy button does indicate that a user found something that was at least a little interesting, even if it eventually led them to a dead end.
Now Thomas had a few potential outcomes—clue captures and copy events. He says, “We started tracking everything and then trying to understand which behaviors correlate to revenue behavior.”
A brief aside: At this point, Thomas shared his challenge with the Continuous Discovery Habits community, explaining the difficulties of getting good data from clue captures and his concerns that copy events were simply a traction metric rather than a good outcome. Teresa weighed in that since copy events were a leading indicator of clue captures, it made sense to set copy events as the outcome. She wrote, “When a traction metric is a strong indicator of value to the customer, it’s okay to set it as your metric. However, you probably want to set a counterweight, something like ‘increase copy events without negatively harming clue capture rate.’ Here’s why: if you just focus on copy events exclusively, you are going to incentivize your team to encourage users to copy events that won’t eventually lead to clue capture. You don’t want that. So you want to make sure that those metrics stay linked.”
The Next Phase: Starting to Connect User Behaviors to Revenue
As we’ve already discussed, Bluestone Analytics tools present a few challenges when it comes to measuring user behavior. Thomas sums it up this way: “There aren’t that many people that do dark web investigations, and their work is cyclical. There aren’t that many purchases and we have a very, very long purchase cycle, so people can take 18 months to make a purchase. And so we still have a really hard time adding a button to our UI and then watching the numbers and then seeing five days later if they go up or not.”
But the team remained committed to finding measurable outcomes for DarkBlue. Due to the long sales cycle, they decided to look at retention. What activities make people come back to DarkBlue more often?
After they’d identified clue captures and copy events as potential outcomes, they conducted a statistical analysis to determine which actions within the tool correlated to retention. In other words, which specific actions increased the chances that a user would return to the tool in the future?
The analysis revealed an interesting trend: If someone logs in today and copies at least five things, they’re much more likely to log in again in two weeks than if they hit copy once or if they save one clue.
This was a huge breakthrough moment for Thomas because it meant evolving the narrative of how people were using the app. As he described earlier, he’d imagined that someone went into the app, looked at a bunch of data, found a bad guy, and saved the evidence. “We pictured this whole investigative lifecycle happening in the app. And so while the end of investigation events like exporting a record still seem logically like they would be most important, what we learned is that copy events were really the most important thing. It’s a much earlier stage in the investigative lifecycle.” He continues, “People get value there, so it’s just a thing that then drives us back into talking to our customers to understand why our copy events are more important than what we thought would be the end of the journey.”
Their original theory about what was their desired product outcome and what was a traction metric turned out not to be accurate. “Reality has revealed that it’s a different framing,” says Thomas. Now they’re using copy events as their desired outcome and clue captures as a health metric.
Thomas shared a few screenshots from his dashboard to help illustrate his learnings. The chart below shows the number of rolling users and which activities they’ve completed, such as copying one time, copying more than five times, or completing a clue capture or what this chart refers to as a “strong signal.”
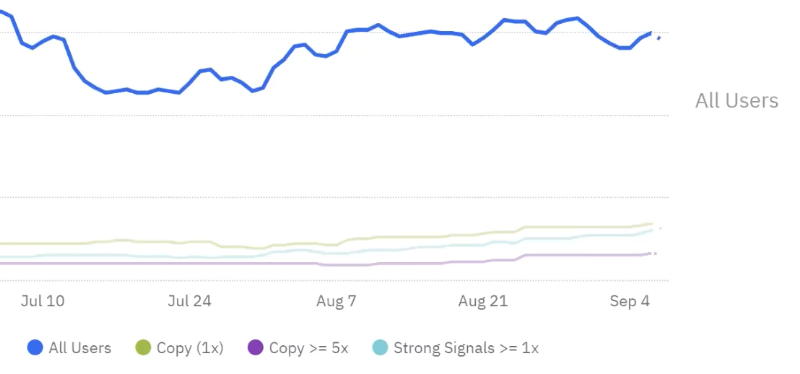
This chart from Amplitude shows the rolling number of users as well as the users who copy one time, those who copy more than five times, and those who complete a “strong signal” event like a clue capture. Click the image to see a larger version.
Next, Thomas shared a chart that shows the relationship between number of copies and retention. If someone logs in on day zero and copies one to four times vs. five or more times, how likely are they to log back in again? It turns out that copying five times is almost 50% more predictive than a little bit of copying, which is not very predictive at all. And 75% of the people who have copied five times come back once every two weeks. “Even these events that we were sure were going to be super predictive didn’t end up being that predictive,” says Thomas.
Even these events in our app that we were sure were going to be super predictive didn’t end up being that predictive. – Tweet This
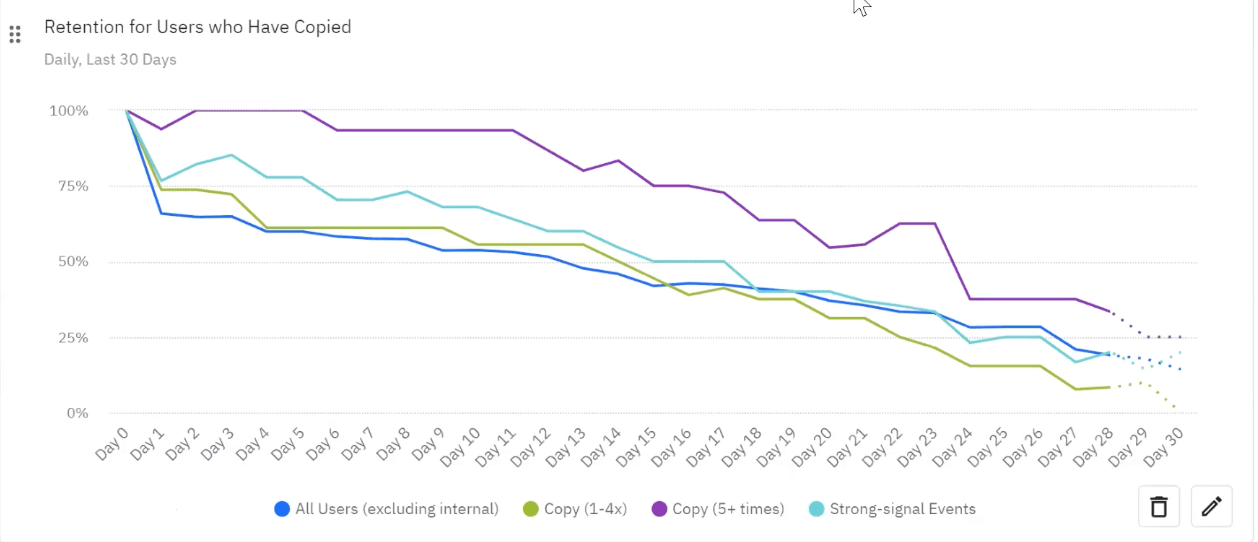
This Amplitude report shows that retention for users who have copied five or more times is significantly better than for users who copied fewer times or performed a strong signal event. Click the image to see a larger version.
To show how they’re slowly improving traction, Thomas shared the chart below, which shows the percentage of active demo or paid users that perform a copy action five times.
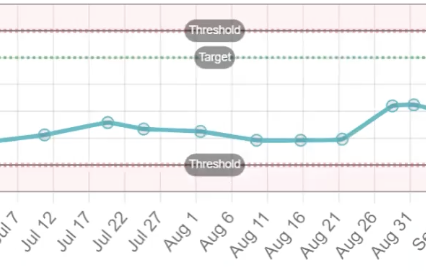
This Vistaly graph shows the percentage of users who have performed a copy action five times over a few months. This proved to be a critical metric for Thomas to track.
Now this is where things get interesting. Thomas says it could be tempting to focus on the chart below instead, which illustrates the number of clue captures over time. At first glance, this looks great—not only has the number of clue captures increased over time, but it’s essentially reached their goal (illustrated by the dotted green line).
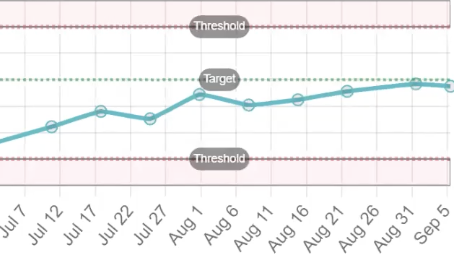
At first glance, this Vistaly chart looks impressive since it has essentially hit the target. But Thomas cautions that it’s not telling us the whole story.
“This is a much more appealing story as a product manager,” says Thomas, “but I don’t want to tell this story, because I know that it would be self-aggrandizing nonsense.”
Wait. What? Why did Thomas say this?
Based on the analysis they’ve done, he now knows that clue captures are a health metric. Clue captures don’t appear to offer the same user value as simple actions like copying more than five times. As Thomas explains it, “It’s the goal we thought was right based on our intuition as internal users. But it doesn’t meet the goal that ended up tracking the behavior of external users.” He continues, “Retention is a good indication of product market fit. And so far, based on our small pool of data, we thought that doing things like sharing something you found in our app or saving it so you could look at it later would be that great indicator of product market fit, but we learned that in fact any activity perusing, coming back and just checking every day might have more value.”
The goal we thought was right based on our intuition as internal users doesn’t meet the goal that ended up tracking the behavior of external users. – Tweet This
To help illustrate this point, Thomas shared the following example. If your job is to work on the physical defense team for the president, you might go into DarkBlue and search for “President Smith kill” and your search might come up dry. You might find nothing. But that would be a win. In that situation, you wouldn’t save a record or share a record.
Not every search ends in catching a bad guy. But that doesn’t mean that users don’t get value out of the tool. “The reality is that maybe we missed that there are other jobs that our customers value,” explains Thomas.
Key Learnings and Takeaways
What has Thomas learned from this process? First, he’s quick to say that he’s far from done—he still has plenty of discovery and learning ahead of him.
But reflecting on what he’s experienced so far, he has a few observations to share. The first is that it’s tough to be in a no or low information environment, but even if that’s your situation, it’s worth taking small steps to gather as much information as you can. “If you keep trying, the juice is worth the squeeze,” says Thomas. If you’re going down this road, just be prepared that it will take time. “We really had to iterate with low information three or four times until we got to a metric that I feel good about,” he adds. “You’ve just got to keep trying things. You can’t give up.”
We really had to iterate with low information three or four times until we got to a metric that I feel good about. You’ve just got to keep trying things. You can’t give up. – Tweet This
Thomas’s other piece of advice is: “Keep an open mind and be wary of your own desire to be central to your user’s world.” Going back to the example of clue captures, Thomas says, “Our comfortable assumption was that users spent hours in the tool and then came out on the other side with the name, address, and social security number of the bad guy. I’m exaggerating here, but we assumed they came away with that winning conclusion and then they went on to whatever was next. And that’s just not the reality for a lot of our users. A lot of our users might dip into our tool to solve a narrow problem, and then go to other tools that solve other problems. And even though that’s sort of less satisfying to my ego, it is more satisfying to customers.”
Keep an open mind and be wary of your own desire to be central to your user’s world. – Tweet This
To sum it all up: “Coming up with some genuine measure of user value and then validating whether you hit the right spot is tough, but it’s really valuable.”
If you’re facing similar challenges with defining your outcomes, you don’t have to face them alone. Come join us in the next cohort of Defining Outcomes, where you’ll get plenty of hands-on practice with like-minded peers!
The post Product in Practice: Iterating on Outcomes with Limited Data appeared first on Product Talk.
Product in Practice: Iterating on Outcomes with Limited Data was first posted on December 13, 2023 at 6:00 am.
©2022 “Product Talk“. Use of this feed is for personal non-commercial use only. If you are not reading this article in your feed reader, then the site is guilty of copyright infringement. Please let us know at support@producttalk.org.

![how-to-reach-your-first-$10k-month-as-an-seo-freelancer-[free-templates]](https://prodsens.live/wp-content/uploads/2023/12/17715-how-to-reach-your-first-10k-month-as-an-seo-freelancer-free-templates-110x110.png)