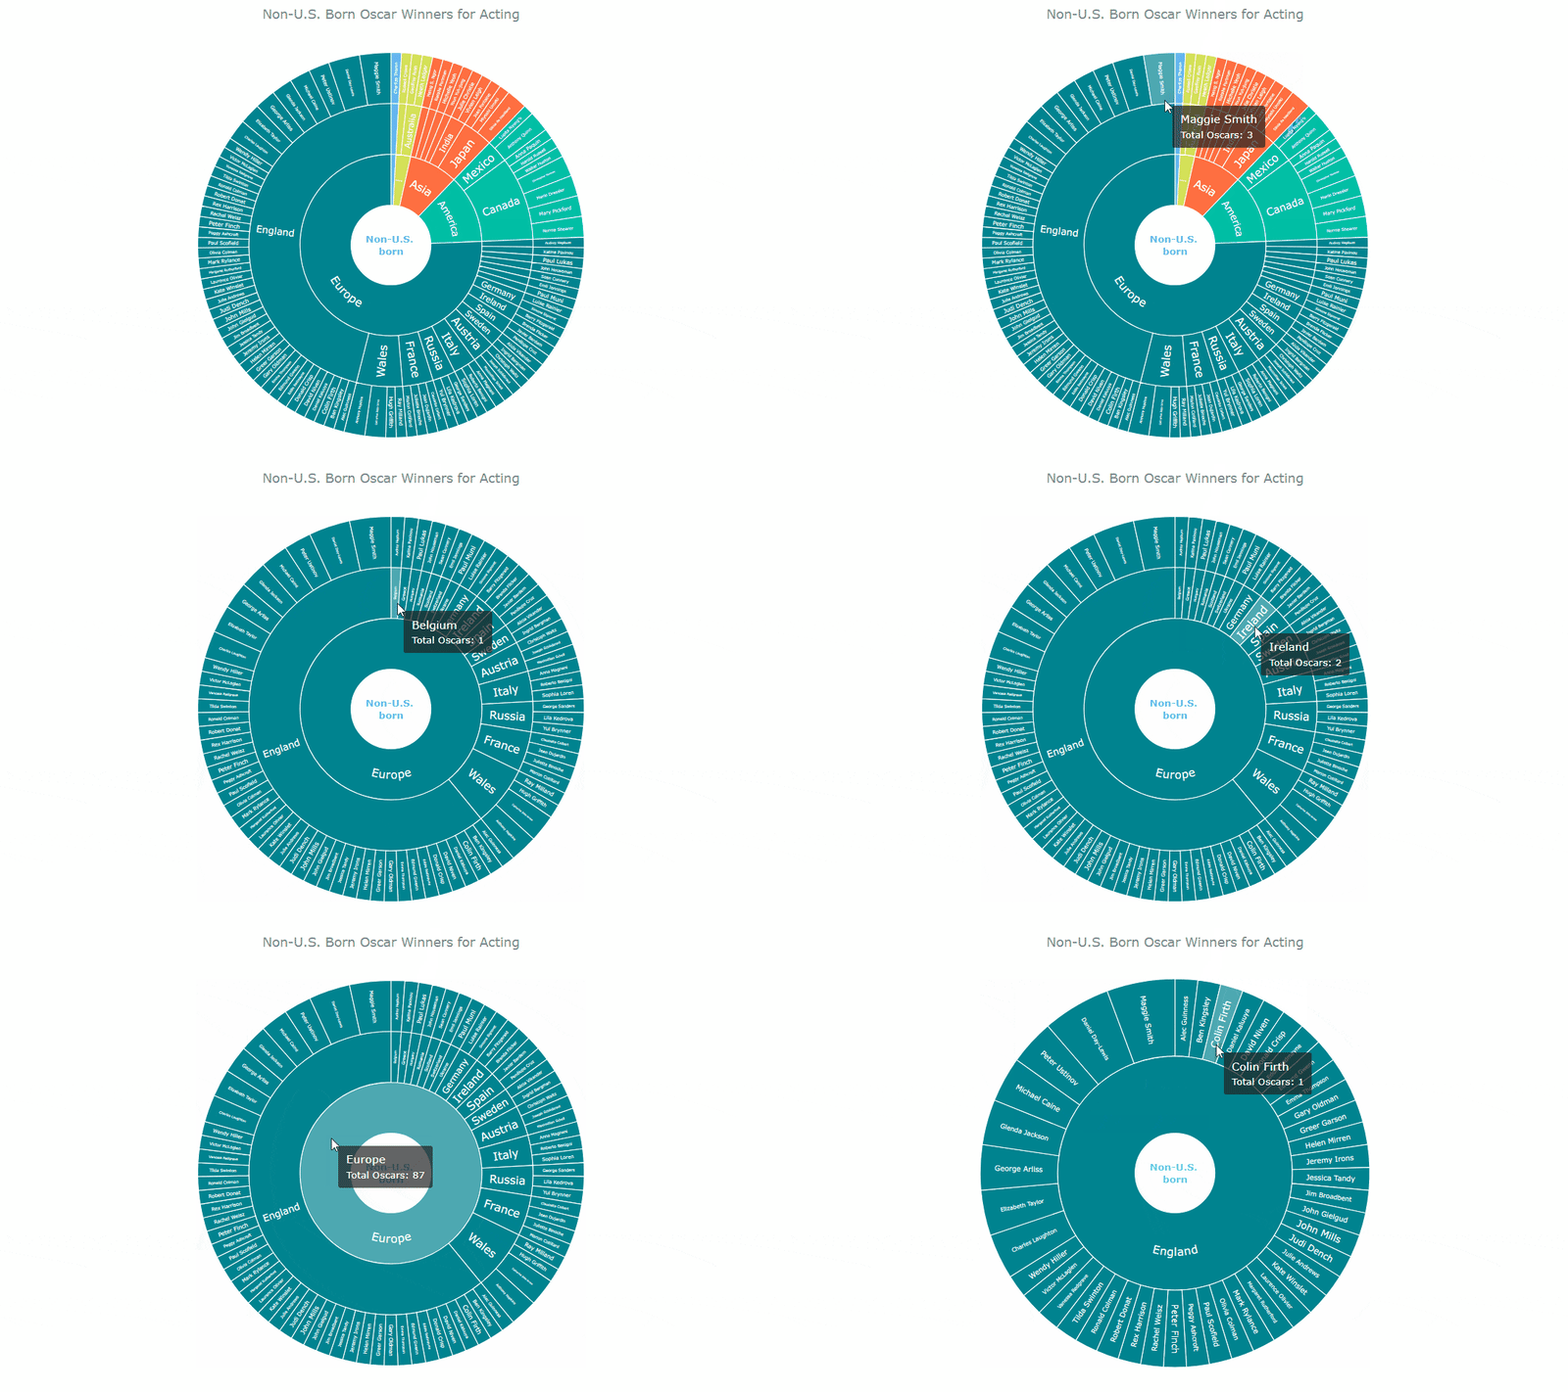
In the world of data all around us, charts play a crucial role in helping us explore and understand data more effectively. One powerful visualization technique is the sunburst chart, which allows us to represent hierarchical datasets, providing insights into complex compositions visually. In this tutorial, I’ll show you how to create your own stunning interactive sunburst charts using JavaScript effortlessly.
We’ll embark on an exciting journey using data about Oscar-winning actors and actresses from countries around the world as an example. Our JS-based sunburst chart will shine a spotlight on the achievements of those born outside the United States, representing the rich diversity of their origins.
Get ready to unlock the secrets of JavaScript sunburst chart development as I’ll guide you step-by-step. Together, we’ll learn how to effortlessly bring data to life, creating this mesmerizing visualization that engages and informs. Let’s dive in and discover the fascinating world of the sunburst chart!
What Is Sunburst Chart?
The sunburst chart, also known as a radial treemap or multi-level pie chart, is a powerful visualization tool used to represent hierarchical datasets. It showcases data in a circular layout, with nested rings that depict different levels of the hierarchy. The innermost ring represents the top level, while the outer rings correspond to subcategories.
Each ring is divided into slices, each showing a specific data point within its respective category. The size of the slices can sometimes indicate the values associated with the data points. Users can drill down to explore more detailed information and gain deeper insights by clicking on a particular level of the hierarchy.
The sunburst chart offers an intuitive and visually appealing way to analyze hierarchical data, enabling users to easily grasp the relationships and proportions between different categories and subcategories. Its interactive nature facilitates exploration and discovery, making it a valuable tool for visual data analytics.
Sunburst Chart Preview
Behold the grand finale of this tutorial, the magnificent interactive JavaScript-based sunburst chart we’ll create together in a step-by-step fashion.
Let’s waste no more time and dive right into the charting process!
Creating Basic JS Sunburst Chart
The concept of the interactive sunburst chart may initially seem daunting and time-consuming when it comes to this data visualization development, but fear not! Let’s break it down into four simple steps. I’ll guide you through each, and you’ll soon realize it’s a breeze.
- Create a web page in HTML
- Include the required JavaScript files
- Add the data
- Write some JavaScript code
1. Create a web page in HTML
Let’s kick off our sunburst chart adventure by creating a simple HTML page as its foundation. We’ll start by setting the page title to “JavaScript Sunburst Chart.”
To contain the chart, we’ll add an HTML block element as a
Then let’s add a touch of style to our chart. Inside the

