Browsing Tag
datavisualization
5 posts
Synchronized, Interactive, Realtime or Animated Data Visualizations on Video Walls
Control rooms, office dashboards, and other video wall installations—beyond traditional signage—are primarily built for visual data analytics. These…

📊 Analyzing Manufacturing Downtime: Insights From My Dashboard
I have created a dashboard to monitor and analyze manufacturing line productivity and downtime factors. The goal of…
Navigating the Risky Waters of Loan Defaults: A Predictive Beacon
In the world of lending the looming challenge of loan defaults presents both risks and opportunities, for banks…
Creating an Interactive Time-Tracking Report with React and TypeScript
🐙 GitHub | 🎮 Demo Building a Comprehensive Report for a Time-Tracking Application Using React, TypeScript, and CSS…
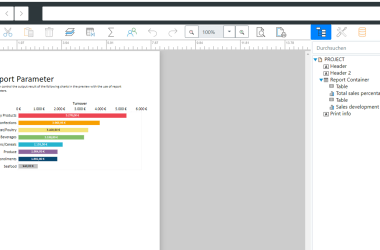
New Features for the Web Report Designer in List & Label 28
The Web Report Designer is a central element if you’re using List & Label in web applications. We’re…