Construction projects generate a lot of data. Timesheets, cost reports, equipment logs, daily reports, subcontractor schedules, material deliveries. The information exists on every project. The problem is that it is usually scattered across spreadsheets, email threads and site notebooks, which means the project manager never has a complete picture without spending an hour pulling it together. By the time the picture is ready, it is already out of date.
A construction dashboard changes that. It pulls the most important information (budget vs. actual costs, schedule progress, equipment utilization, task status) into a single view that can be read in a minute and updated quickly. It does not replace the detailed reports and logs that feed into it. It replaces the time spent hunting through them to answer a question that should have an obvious answer: how is this project doing right now?
We put together five free construction dashboard templates for Excel that cover the metrics construction managers need most, from budget tracking to asset management. Each one is free to download and ready to adapt for your projects.
1. Construction Budget Dashboard for Excel
Cost overruns are the most common way construction projects fail. Labor comes in higher than estimated, materials prices shift, change orders accumulate and by the time the variance is obvious it is too late to course-correct without painful conversations with the owner. The problem is usually not that the data is not there. It is that nobody is looking at the full picture in one place on a regular basis. A budget dashboard makes that regular review effortless.
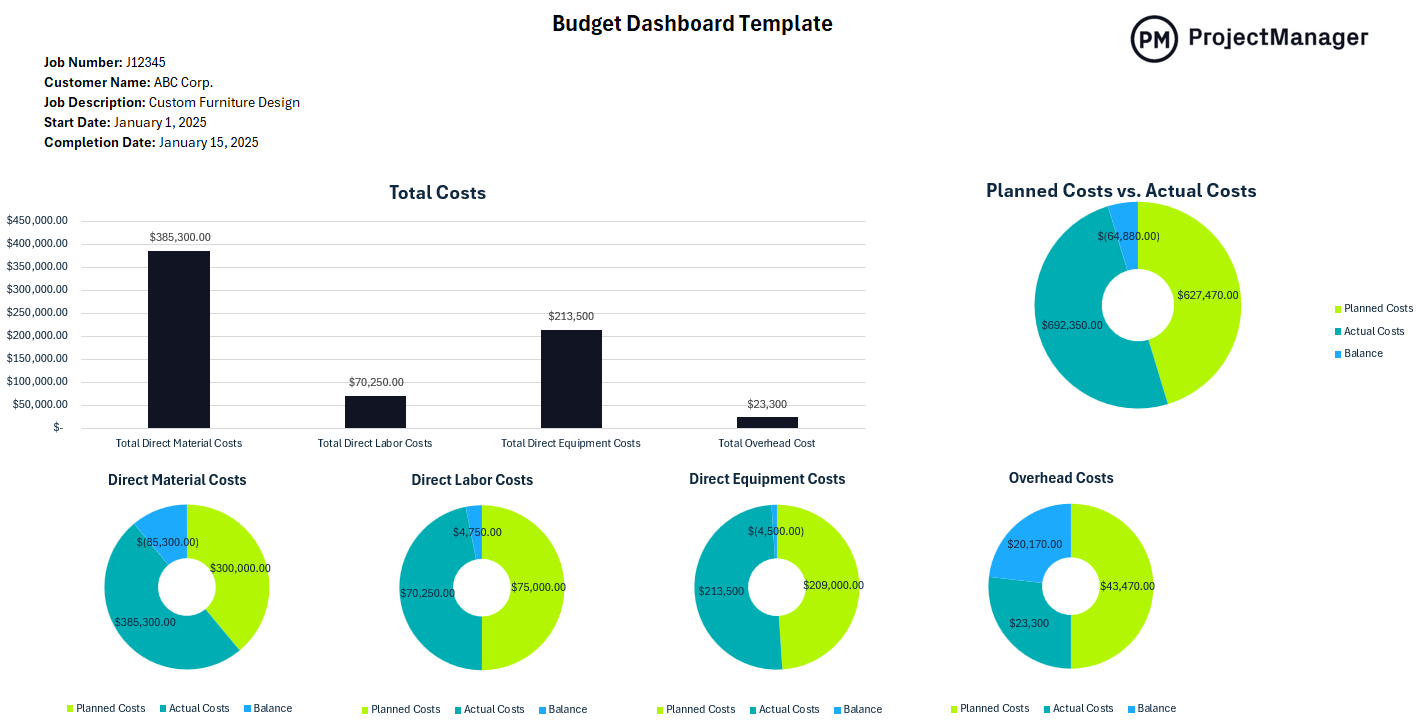
This Excel dashboard tracks planned versus actual costs across project phases or cost categories, with variance calculations that immediately show where the project is running over or under. Summary charts give you a visual read on budget health that is easier to absorb than a line-item cost report, while the detailed breakdown underneath supports deeper investigation when a variance needs explaining. Update it from your cost logs and the picture is current in minutes.
The right tool for any construction manager or project owner who needs a regular read on cost performance and wants a single document they can share with stakeholders that shows where the money has gone and how much is left.
2. Construction Project Dashboard for Excel
A project dashboard gives everyone involved in a construction project the same view of where things stand. Schedule, budget, milestone completion, open issues and risk status. The information that a project owner, site manager and subcontractor need to know is often the same information, just presented at different levels of detail. A dashboard handles the top-level view so the detailed conversations happen only where they are actually needed.
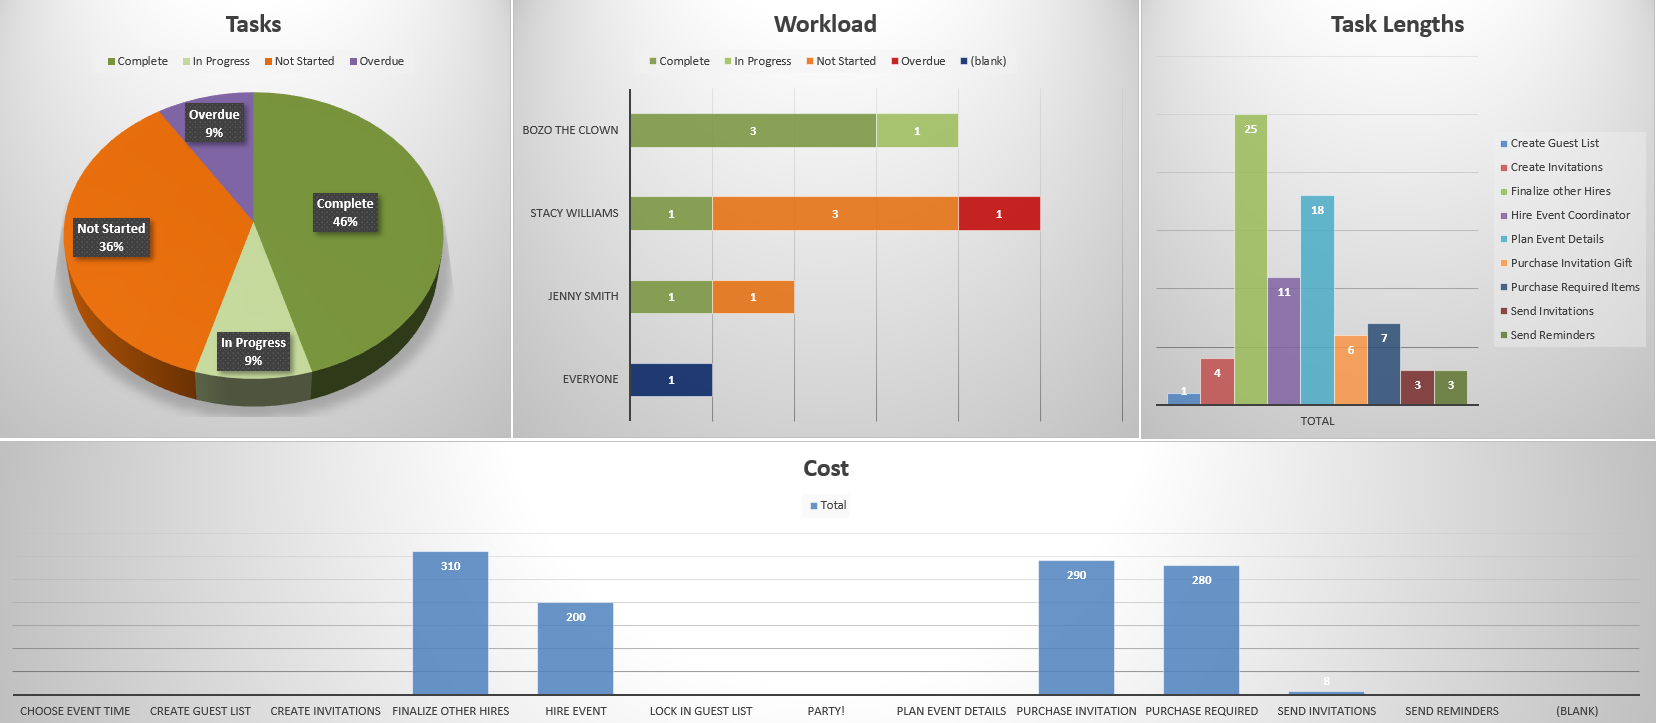
This Excel dashboard covers the key dimensions of project health: schedule progress against the baseline, budget performance, milestone status, task completion by phase and a risk and issue summary. It is designed to be updated weekly and shared at project meetings as the single reference point for project status. This reduces the time spent on status discussions and focuses the meeting on decisions rather than reporting.
Most useful for general contractors and construction managers running multi-phase projects who need a consistent reporting format that keeps all stakeholders aligned without requiring a separate status report for each audience.
Get AI-Powered Construction Dashboards: No Manual Updates Required
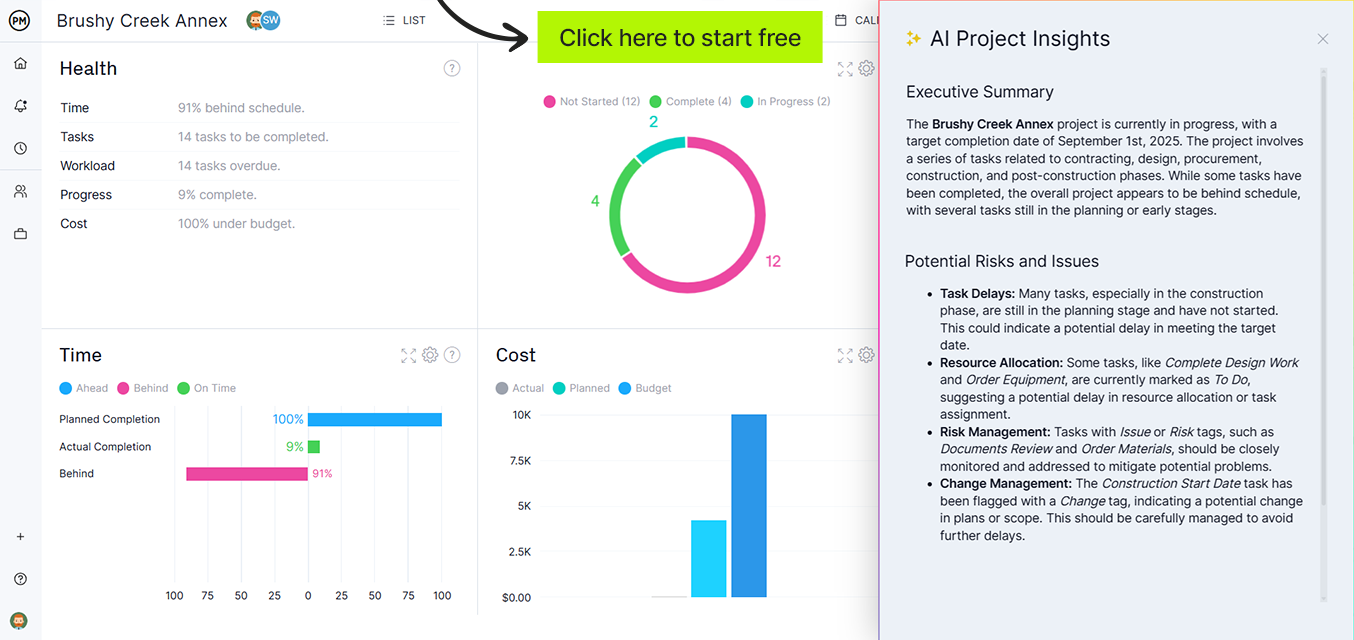
ProjectManager‘s dashboards update automatically as your team logs hours, completes tasks and records costs. No spreadsheet maintenance required. AI-powered insights surface budget risks and schedule issues across your project so you see what needs attention before it becomes a problem. Try it free for 30 days.
3. Construction KPI Dashboard for Excel
Construction projects run on metrics. Safety incident rates, schedule performance index, cost performance index, rework rates, subcontractor delivery scores. The key performance indicators that tell you whether a project is being managed well are well-established. The challenge is tracking them consistently across a project and making them visible in a format that drives action rather than just accumulating in a spreadsheet no one reads.

This Excel dashboard tracks your selected KPIs against target values with visual indicators that immediately flag which metrics are on track and which need attention. You define the KPIs that matter for your project (safety, cost, schedule, quality, productivity), and the dashboard shows performance against target at a glance. The trend view shows whether performance is improving or deteriorating over time, which is often more useful than the current reading alone.
Particularly useful for construction firms that need to report project performance to owners or lenders on a consistent basis, or for project managers who want to track the leading indicators of project health rather than waiting for lagging indicators like cost overruns and missed deadlines to surface.
4. Construction Task Tracker Dashboard for Excel
On an active construction site, dozens of tasks are in motion simultaneously across multiple trades and subcontractors. Knowing which ones are complete, which are in progress, which are blocked and which are overdue is the project manager’s core job, and without a centralized view, it requires constant check-ins with individual crews and subs to get a picture that is outdated by the time you have assembled it. A task tracker dashboard replaces that manual gathering with a single updated document.
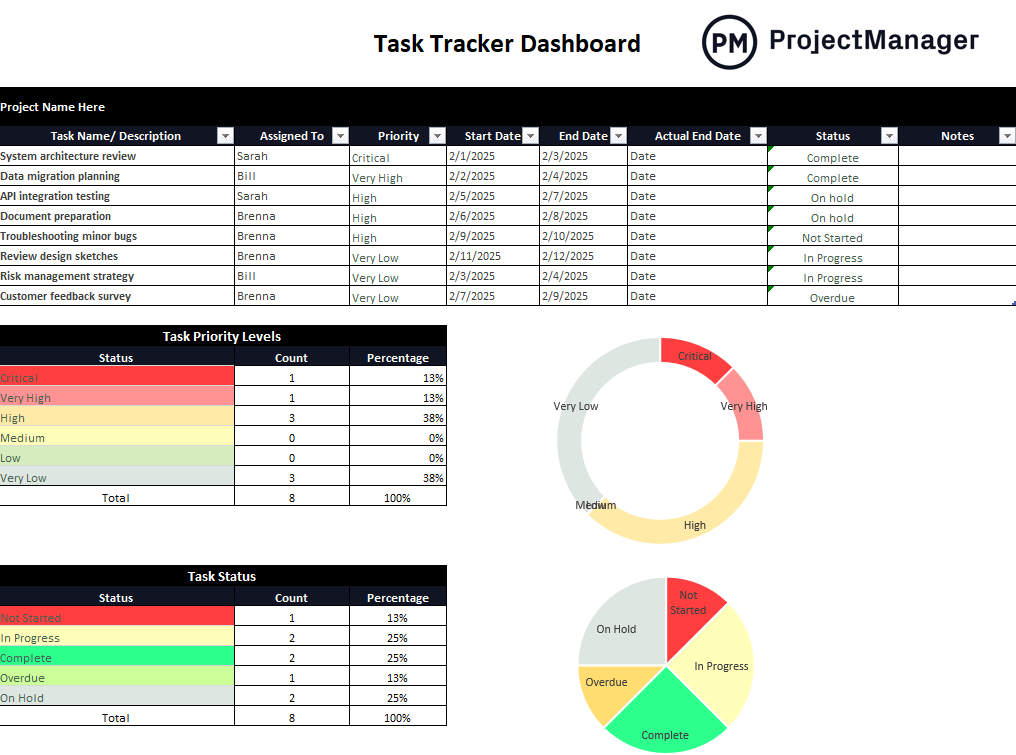
This Excel dashboard logs tasks by phase or trade with columns for owner, start date, due date, status and completion percentage. Summary charts show overall task completion progress and the breakdown of open, in-progress and completed tasks at a glance. Updated daily or at the start of each shift, it gives the site manager a current view of work status across the whole project without having to chase individual updates from every crew.
Most useful for general contractors and site managers coordinating multiple subcontractors across concurrent work packages, or for any project where the volume of parallel tasks makes informal tracking unreliable.
5. Construction Asset Management Dashboard for Excel
Equipment is one of the largest cost centers on a construction project and one of the least systematically tracked. Machinery sitting idle because a crew finished early, equipment double-booked between two sites, maintenance overdue on a critical piece of plant. These problems cost money and cause schedule delays that are entirely preventable with basic asset visibility. An asset management dashboard gives you that visibility without a dedicated asset management system.
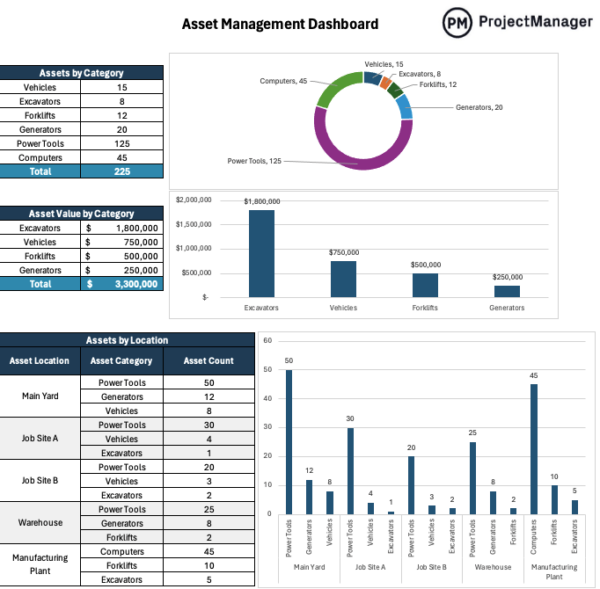
This Excel dashboard tracks your equipment and major assets with fields for asset name, type, location, assigned project or crew, current status, utilization rate and maintenance schedule. The summary view shows which assets are deployed, which are available and which are due for maintenance, giving the project manager and equipment coordinator the information they need to allocate resources efficiently and avoid the downtime that comes from missed servicing or scheduling conflicts.
Best used by construction managers and operations teams running equipment across multiple sites or projects, where knowing the location and status of each asset at any moment is the difference between efficient deployment and expensive idle time.
Manage Construction Projects With Live Dashboards in ProjectManager
Excel dashboards give you a snapshot updated as often as you update the file. ProjectManager gives you a live construction dashboard that updates automatically as tasks are completed, hours are logged and costs are recorded. No manual data entry required to keep the picture current. For construction managers who need to stay on top of fast-moving projects, the difference between a snapshot and a live view is the difference between reacting to problems and preventing them.
Track Costs and Schedule in Real Time
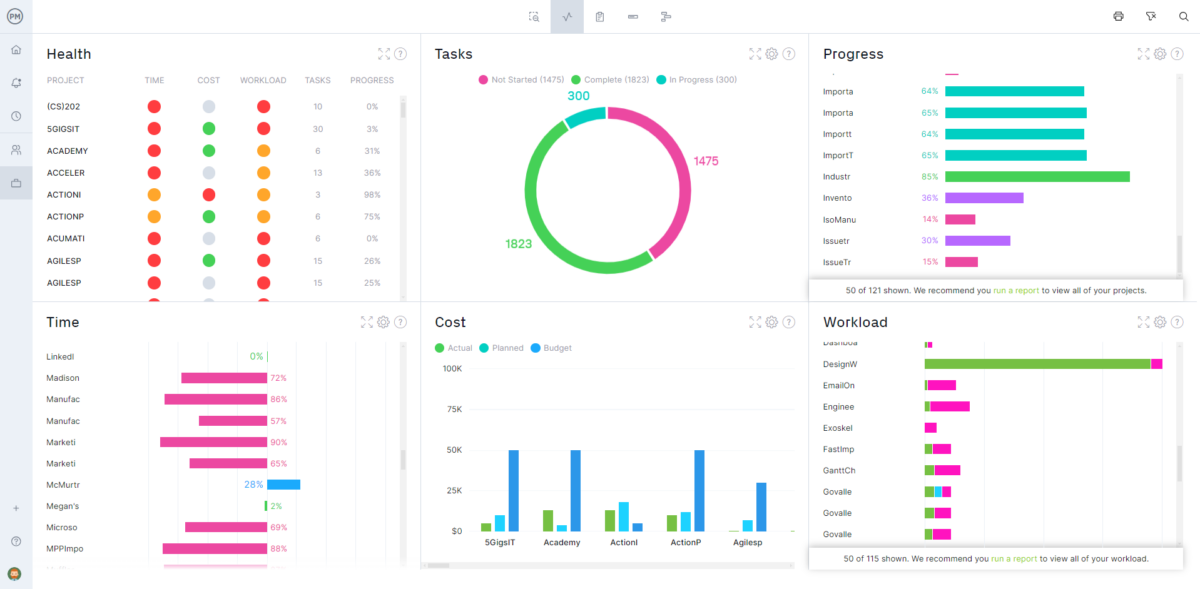
ProjectManager’s construction dashboard pulls live data from your Gantt chart, timesheets and budget tracking tools so cost performance and schedule progress are always current. When a trade falls behind or a cost category goes over budget, you see it immediately rather than at the next weekly update. The same dashboard view can be shared with project owners and stakeholders so everyone is working from the same current picture without a separate reporting process.
Coordinate Every Crew and Subcontractor From One Plan
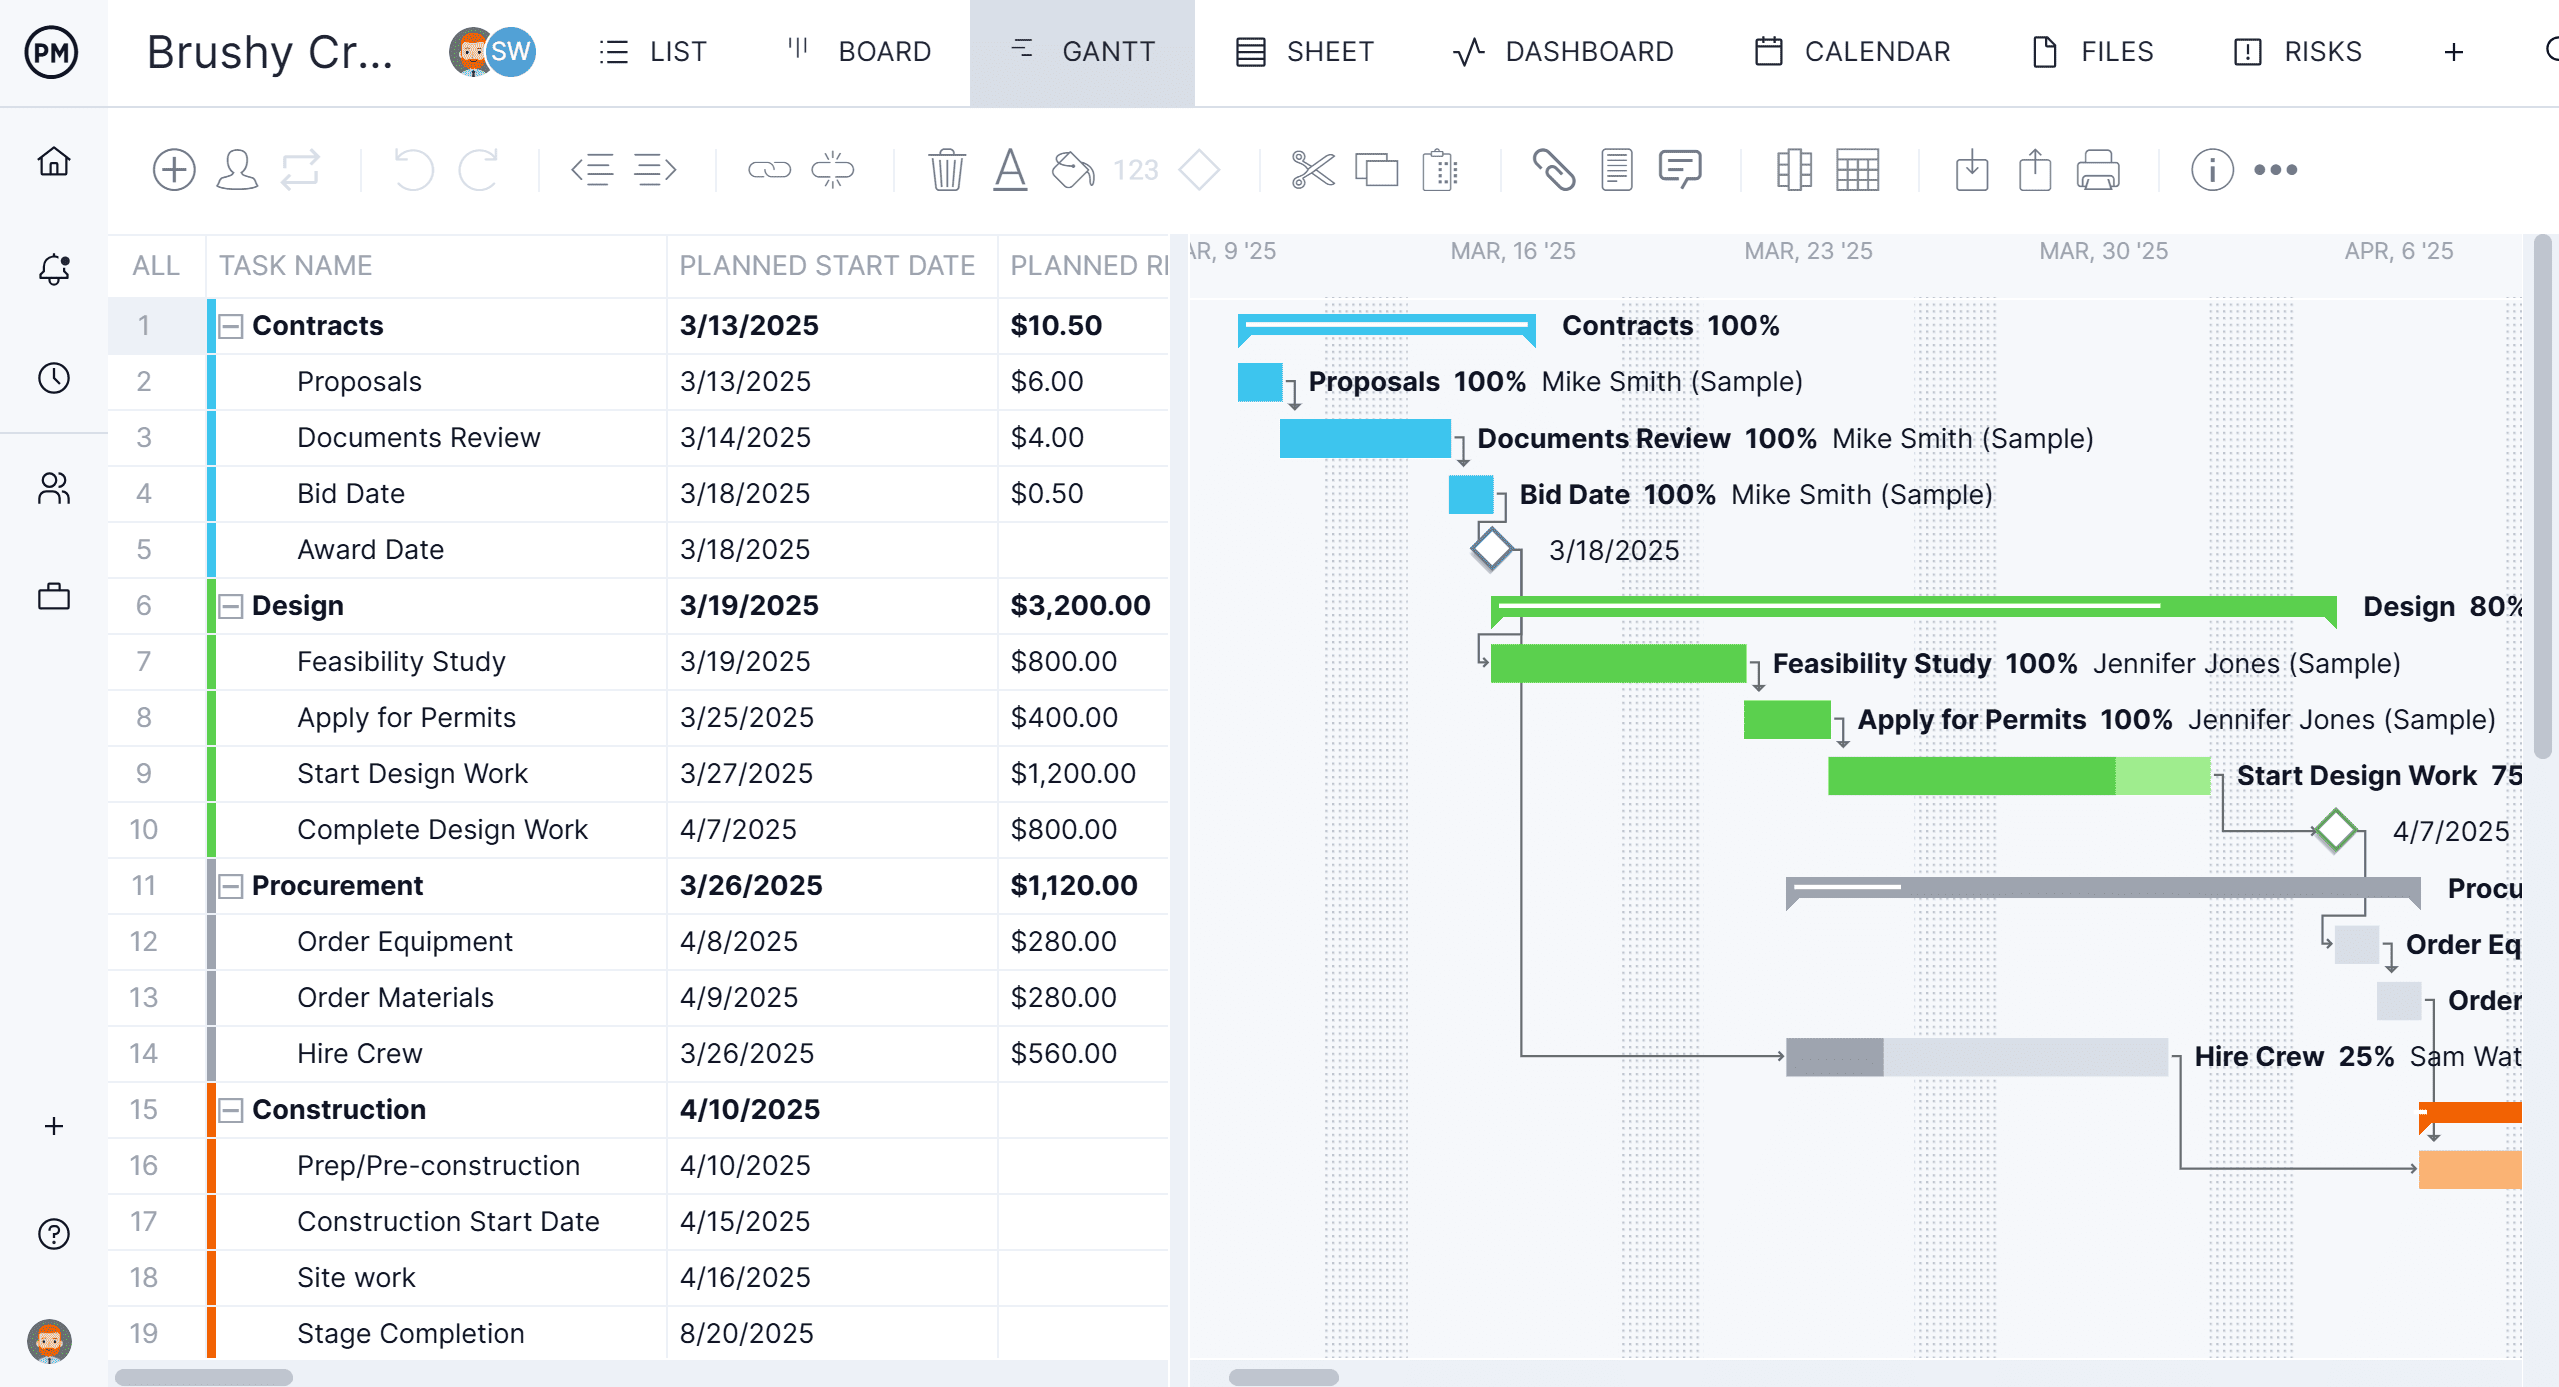
ProjectManager’s Gantt chart and workload tools let you schedule every phase of the construction project, assign tasks to crews and subcontractors and track progress as work is completed. Dependencies keep the schedule logic intact. When one task slips, you see the downstream impact immediately rather than discovering it when the affected crew shows up to start work that is not ready for them. The whole team works from the same plan, updated in real time.
Related Content
- 9 Free Construction Invoice Templates for Excel and Word
- 25 Free Project Management Templates for Excel
- 9 Free Contingency Plan Templates for Excel and Word
- 10 Free Status Report Templates for Word and Excel
- 8 Free Work Schedule Templates for Excel
- 10 Free Construction Plan Templates for Excel and Word
- Construction Reporting: Types of Construction Reports
- Construction Work Breakdown Structure: A Guide to WBS
- Making a Construction Schedule: Construction Scheduling Basics
The post 5 Free Construction Dashboard Templates for Excel appeared first on ProjectManager.