A project plan written in paragraphs tells people what is happening. A project diagram shows them. There is a meaningful difference. When a stakeholder can see the full timeline at a glance, or when a team member can trace a dependency chain without reading through a status update, decisions get made faster and fewer things fall through the gaps. That is what diagrams do that documents cannot.
The challenge is that building a diagram from scratch takes time most project managers do not have. A blank canvas is not a starting point: it is a reason to skip the diagram entirely and send another email instead. A good template changes that. It gives you the structure, the format and the logic of the diagram pre-built so you can focus on filling in the details specific to your project.
We put together a collection of seven free project diagram templates covering the most commonly used visual formats in project management. Each one is free to download for Excel or Word and ready to adapt for your project.
1. Gantt Chart Template for Excel
A Gantt chart is the most widely used project diagram in existence for good reason. It maps every task in your project against a timeline so anyone on the team can see what needs to happen, in what order and by when. For projects with more than a handful of tasks, it is the clearest way to communicate the plan without a meeting.

This Excel template includes a task list on the left and a timeline bar chart on the right, with columns for task name, owner, start date, duration and status. The bars update based on your dates so the visual stays accurate as you fill in your plan. It covers everything a basic project plan requires without the complexity of dedicated software.
The right starting point for any project where you need to show a timeline to a sponsor or client, or where your team needs a shared reference for what is due and when.
2. PERT Chart Template for Excel
A PERT chart (Program Evaluation and Review Technique) maps the sequence of tasks in a project as a network of nodes and arrows, making dependencies visible in a way a task list cannot. Where a Gantt chart shows when things happen, a PERT chart shows why things have to happen in a certain order: which task cannot start until another finishes.
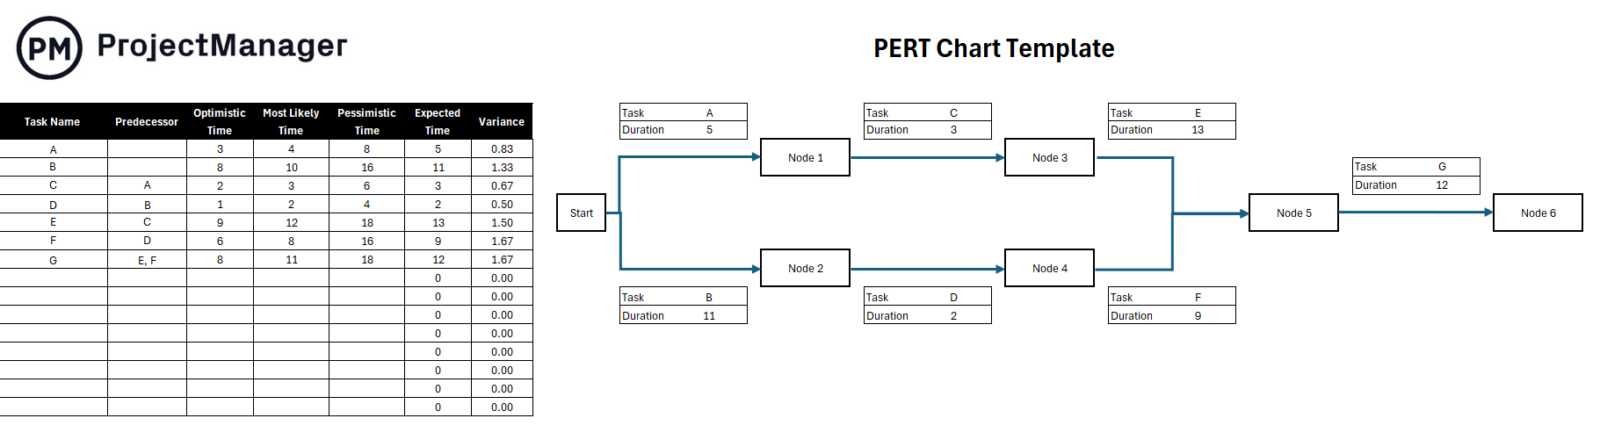
This template lays out the node-and-arrow structure of a PERT chart in Excel, with placeholders for task names, durations and dependency links. It also supports three-point estimation (optimistic, most likely and pessimistic) so you can build a realistic schedule that accounts for uncertainty rather than treating every estimate as a fixed number.
Most useful in the planning phase when you need to identify your critical path and figure out which tasks have float and which have none.
Plan and Track Your Project Diagrams in ProjectManager
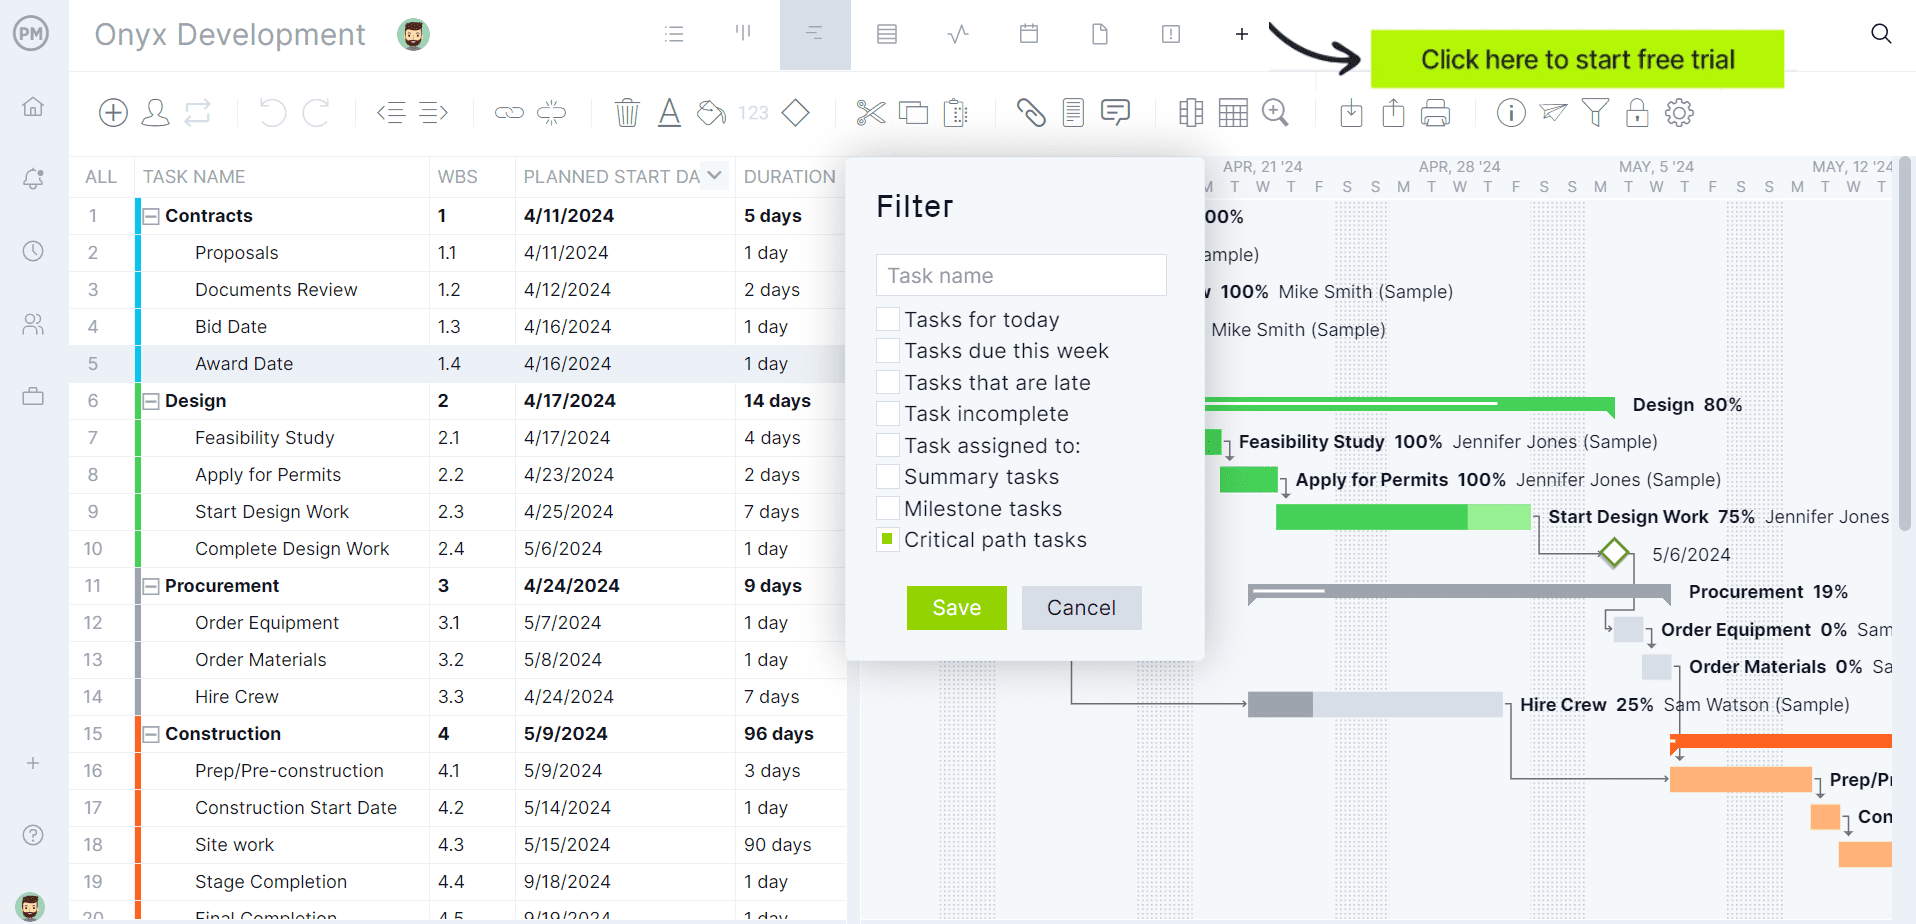
Templates give you a starting point. ProjectManager gives you a live project plan that updates as work progresses. Build real Gantt charts with drag-and-drop scheduling, map dependencies between tasks and track progress in real time, all without rebuilding your diagram every time something changes. Try it free for 30 days.
3. Work Breakdown Structure Template for Excel
A work breakdown structure (WBS) takes the full scope of a project and breaks it into smaller, manageable components organized in a hierarchical tree. It is the diagram that answers “what exactly are we delivering?” before the project starts, making it one of the most valuable planning tools available and one of the most skipped.
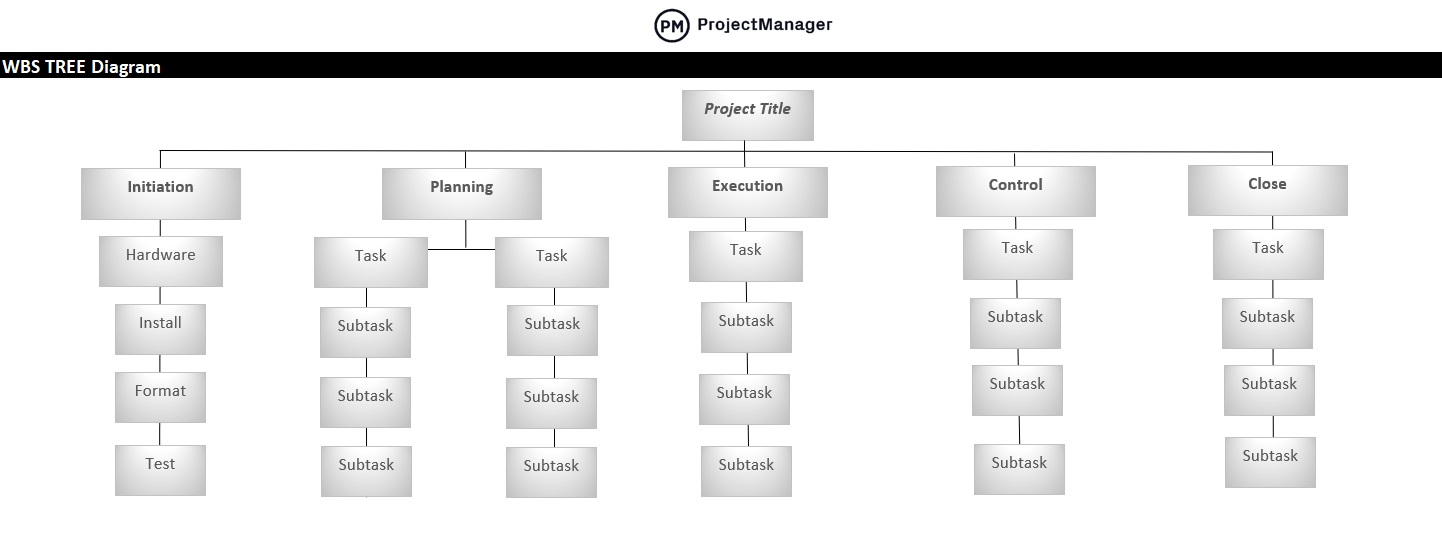
This template gives you a pre-built WBS tree structure in Excel with expandable levels for project phases, deliverables and work packages. Each node in the tree represents a distinct piece of scope, making it easy to assign ownership, estimate effort and ensure nothing gets missed before the project kicks off.
Best used at the start of a project before scheduling begins. A solid WBS becomes the source of truth that feeds the Gantt chart: the tasks in your schedule should map directly to the work packages in your WBS.
4. Project Network Diagram Template for Excel
A project network diagram visualizes the relationships between every task in a project as a flow of connected nodes. Unlike a Gantt chart, which is anchored to calendar dates, a network diagram focuses purely on the logic of task dependencies: what leads to what and what the critical path through the project looks like.
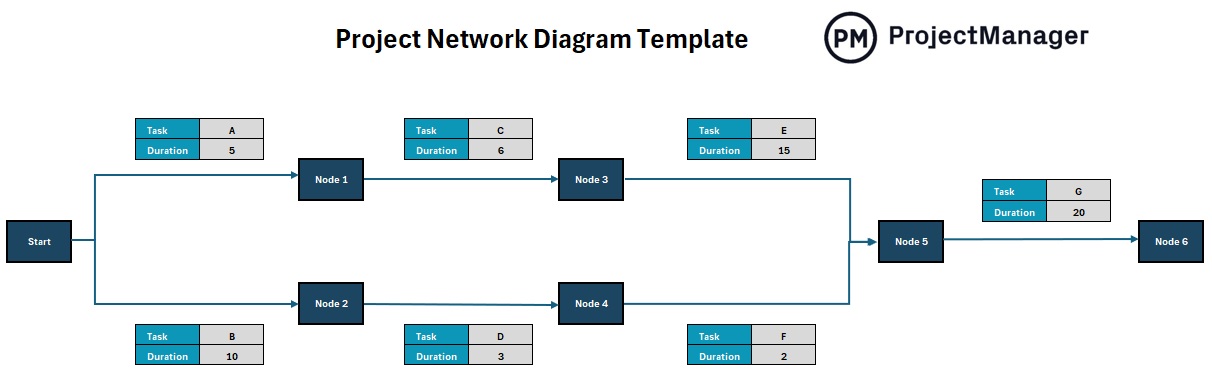
This Excel template provides a node-based layout for mapping task sequences and dependencies across a project. Each node includes fields for task name, duration and dependency links so you can trace the full flow of work from project start to finish and identify where delays will cascade.
Particularly useful for complex projects with many parallel workstreams where understanding the dependency chain is more important than knowing the specific calendar dates.
5. Swimlane Diagram Template for PowerPoint
A swimlane diagram organizes a process or workflow into horizontal or vertical lanes, with each lane representing a different team, department or role. It makes handoffs visible: you can see exactly where work moves from one person or group to another, which is where most process breakdowns happen.
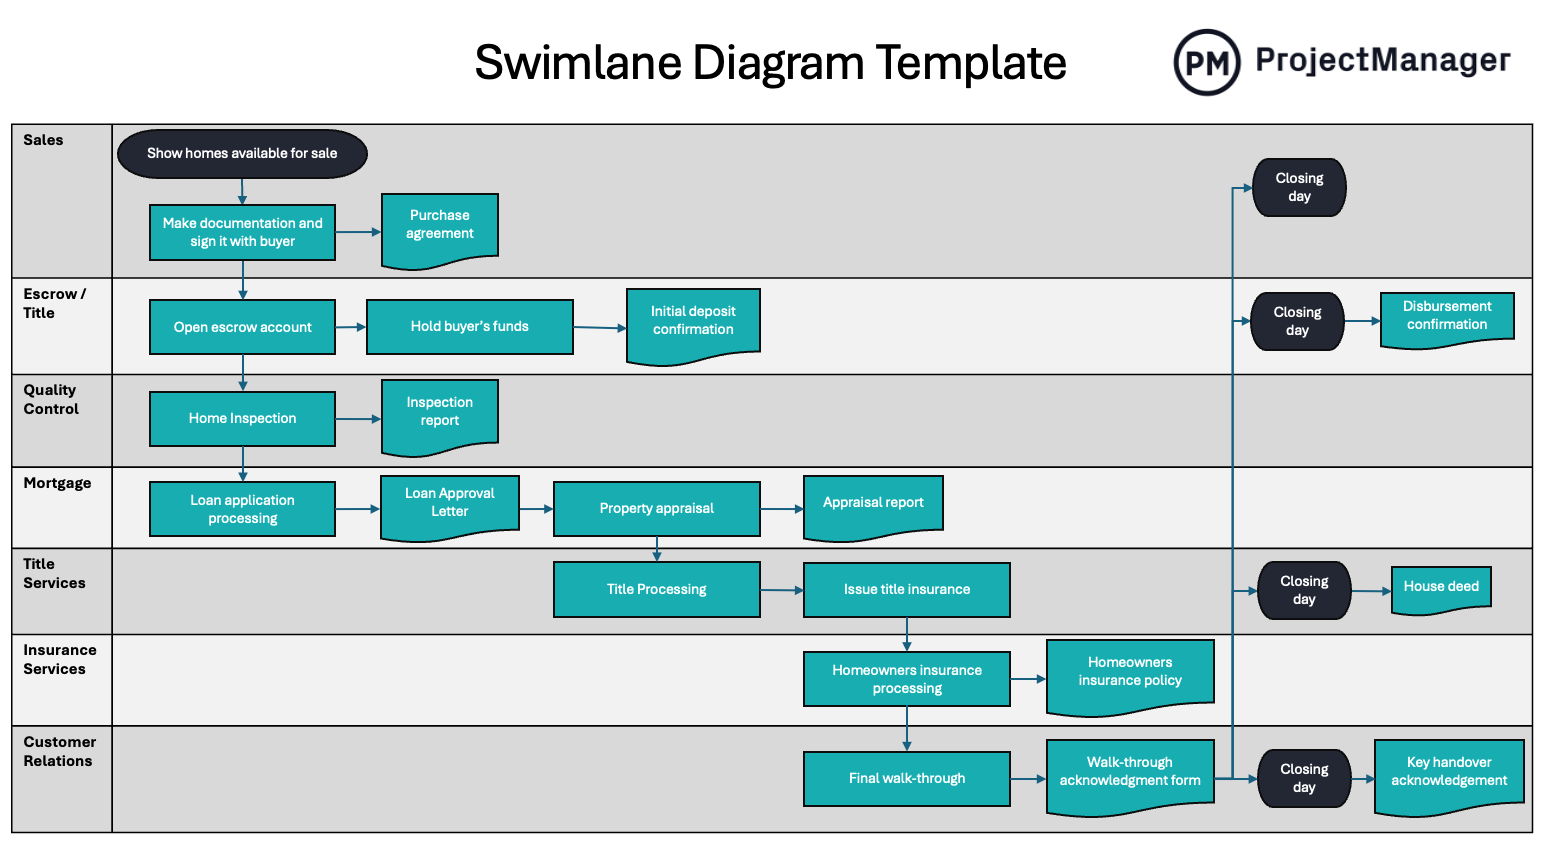
This template provides a clean multi-lane layout in PowerPoint with placeholder process steps and arrows showing the flow of work between lanes. It is flexible enough to map any cross-functional process, from a project approval workflow to a product development cycle to a client onboarding sequence.
The right tool any time accountability is unclear or handoffs are a recurring problem. Drawing the swimlane diagram often reveals the bottleneck in under an hour.
6. Flowchart Template for Word
A flowchart maps a process as a sequence of steps and decision points, using standard shapes to distinguish actions from decisions from start and end states. It is one of the most universally understood diagrams in business: anyone can follow a flowchart without training, which makes it the right choice when clarity for a broad audience matters.
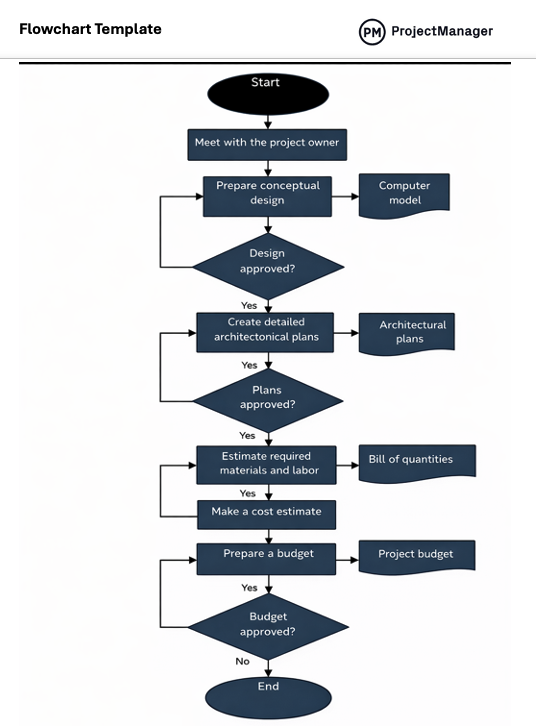
This Word template includes the standard flowchart shape library: rectangles for process steps, diamonds for decisions and ovals for start and end points, arranged in a vertical flow with connecting arrows. It is pre-formatted and ready to edit, so you can map any process without touching a drawing tool from scratch.
Works for anything that follows a defined sequence with conditional branches: approval workflows, escalation processes, onboarding checklists or troubleshooting guides.
7. Org Chart Template for Excel
An organizational chart diagrams the reporting structure of a team or company: who reports to whom and how roles relate to each other. In a project context, it serves a different but equally important purpose, clarifying who owns what and who has decision-making authority, which is the source of more project confusion than most teams realize.
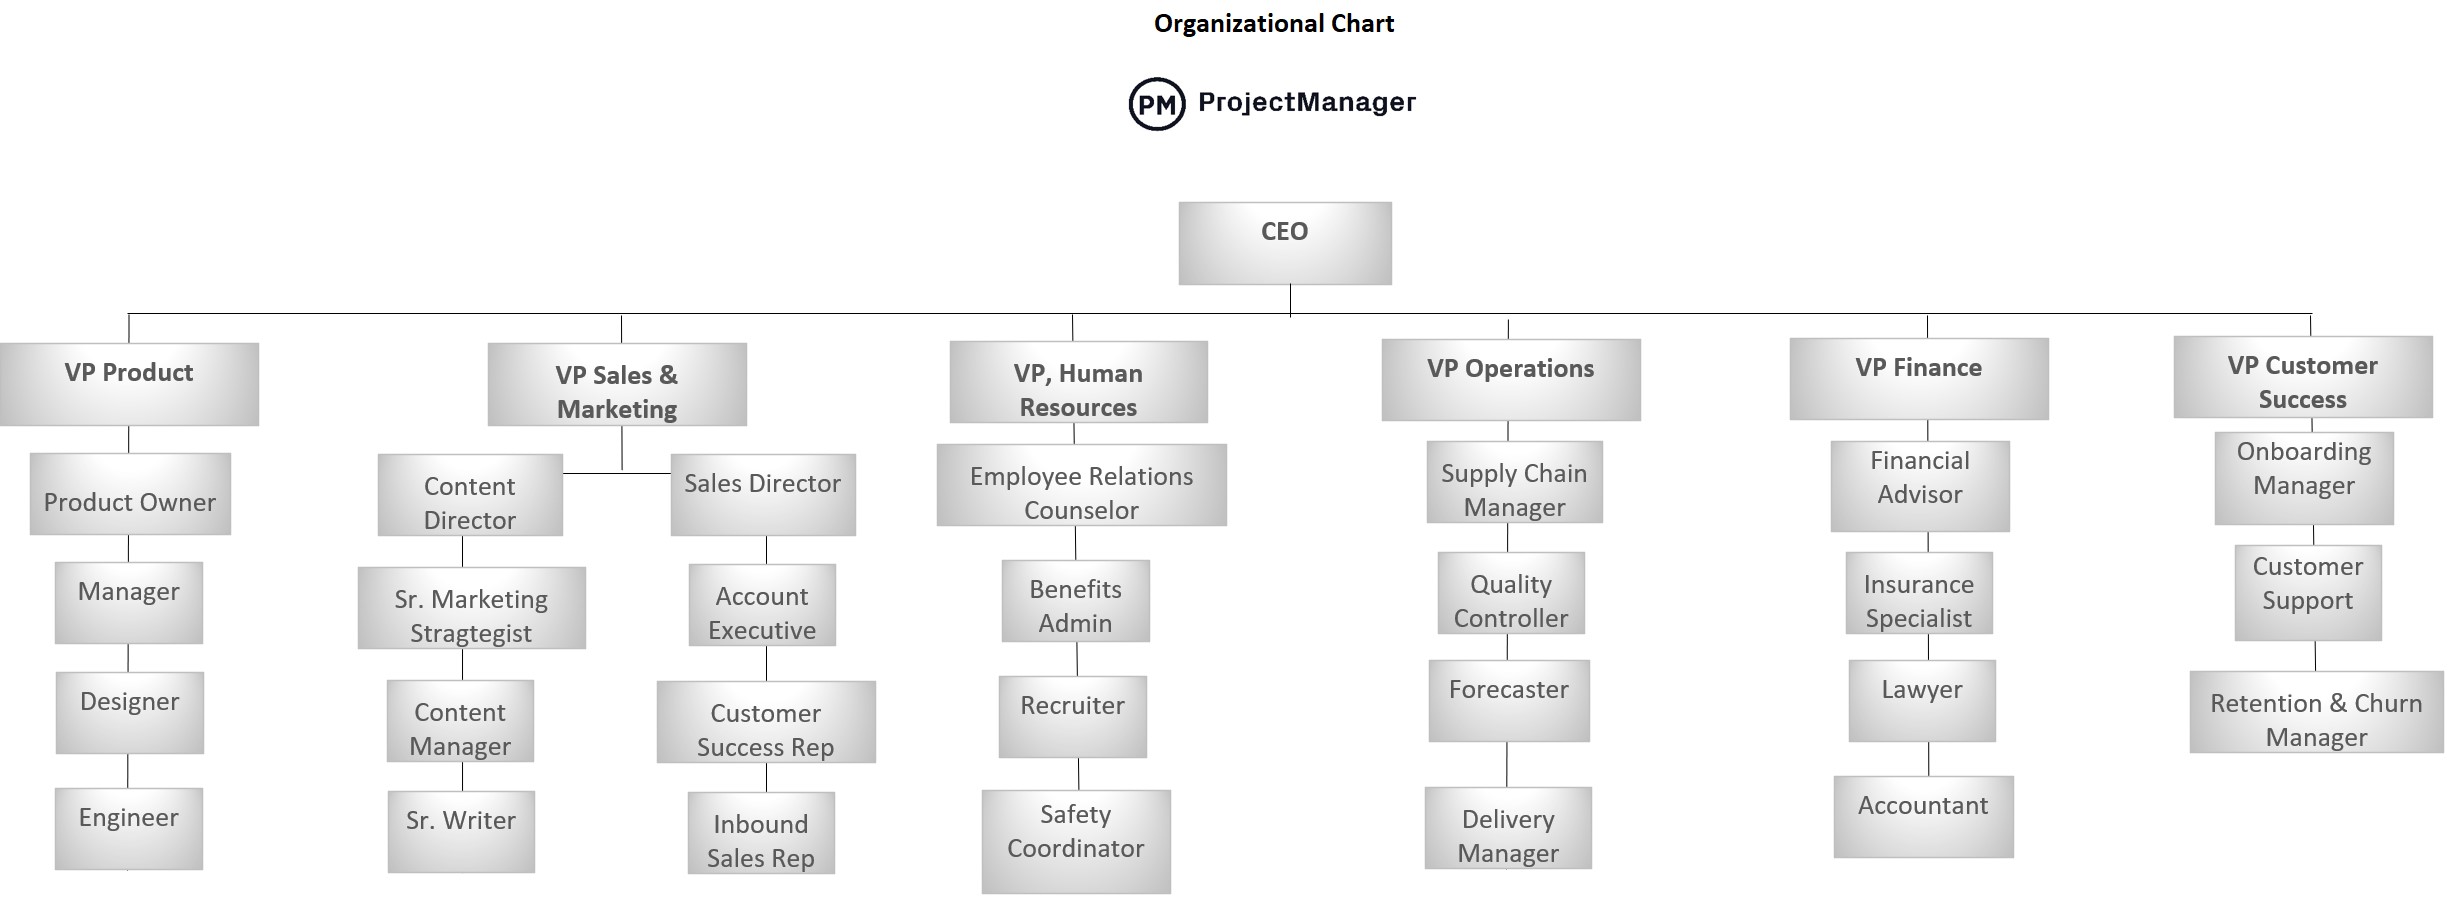
This Word template provides a hierarchical org chart structure with editable name and title fields at each level. It is straightforward to adapt for a full company org chart or a project-specific structure showing team leads, workstream owners and stakeholder relationships.
Most useful at project kickoff when roles are still being established, or when a new team member joins and needs to understand the structure quickly without scheduling a meeting to explain it.
Build Better Project Diagrams With ProjectManager
Templates are a starting point. The limitation is that a diagram built in Excel or Word is static: the moment the project changes, the diagram is out of date. ProjectManager connects your diagrams to live project data so your plan reflects what is actually happening, not what you planned three weeks ago.
From interactive Gantt charts to real-time dashboards, ProjectManager gives project managers the visual tools they need to plan, track and communicate project status without rebuilding a diagram every time something shifts.
Interactive Gantt Charts With Live Dependencies
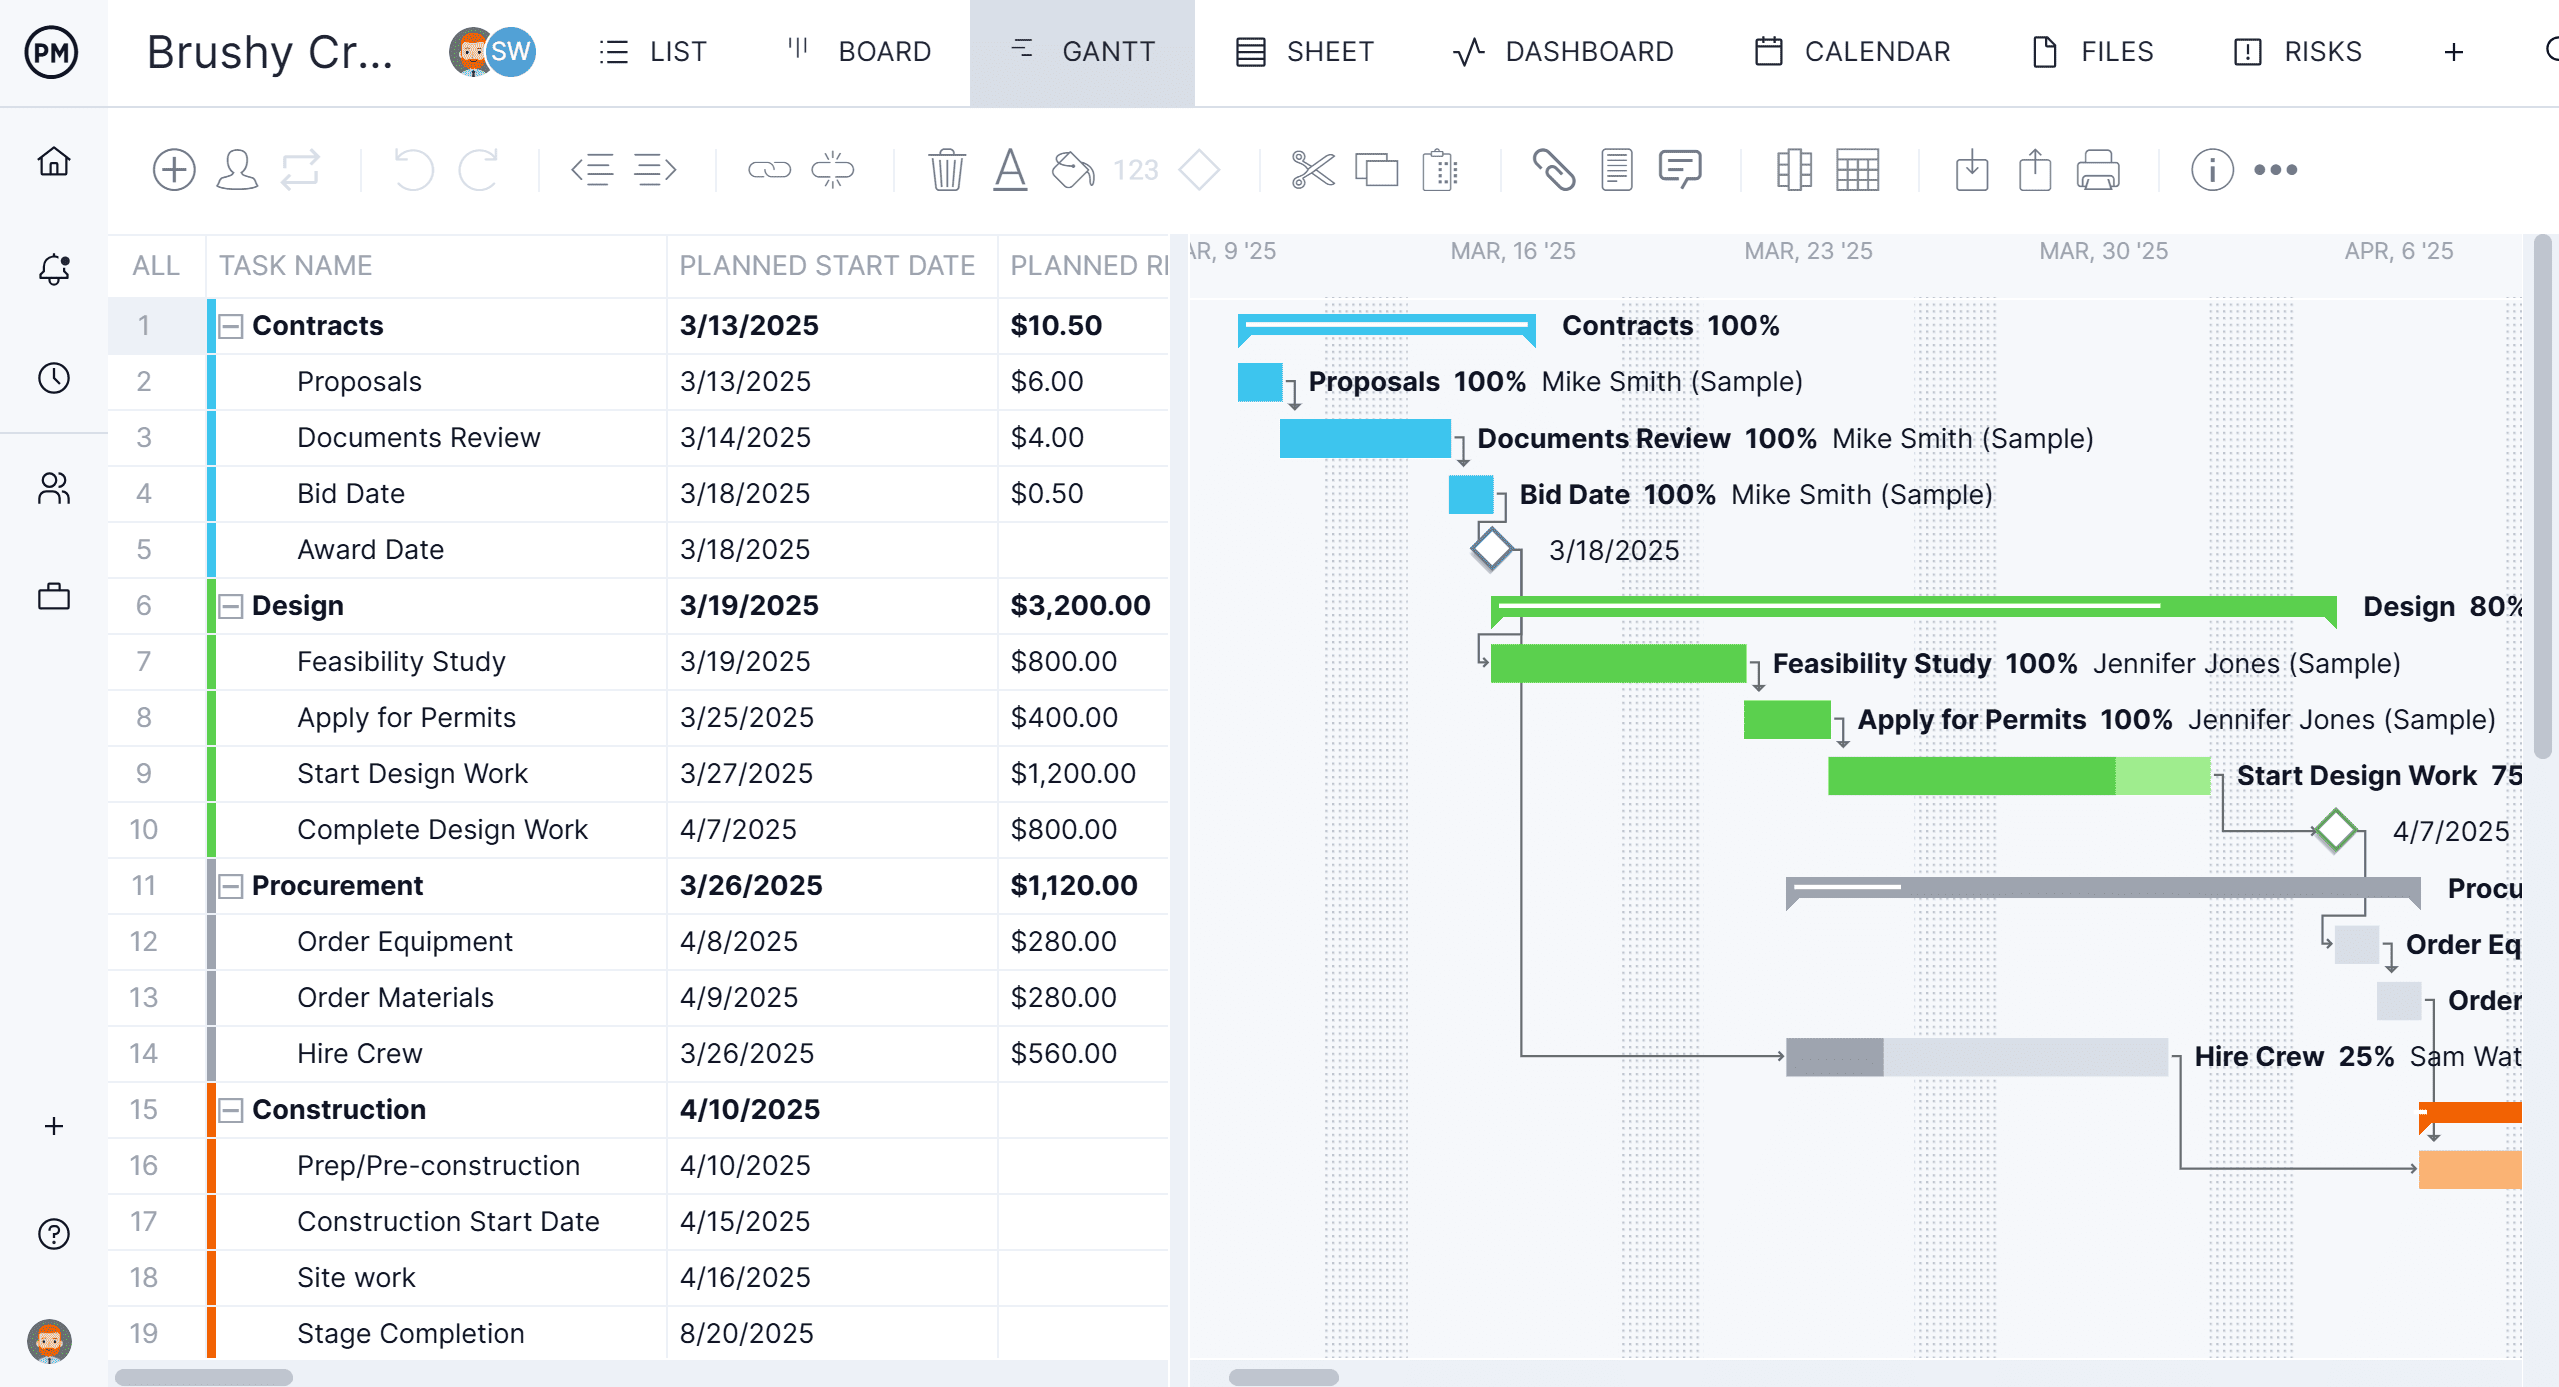
ProjectManager’s Gantt chart is not a static image: it is a live project plan. Add tasks, link dependencies and set baselines, then watch the chart update automatically as work gets completed or timelines shift. Drag a task to reschedule it and every downstream dependency moves with it. For teams managing complex projects with many dependencies, that kind of real-time accuracy is the difference between a plan people trust and one they ignore.
Real-Time Dashboards for Every Stakeholder
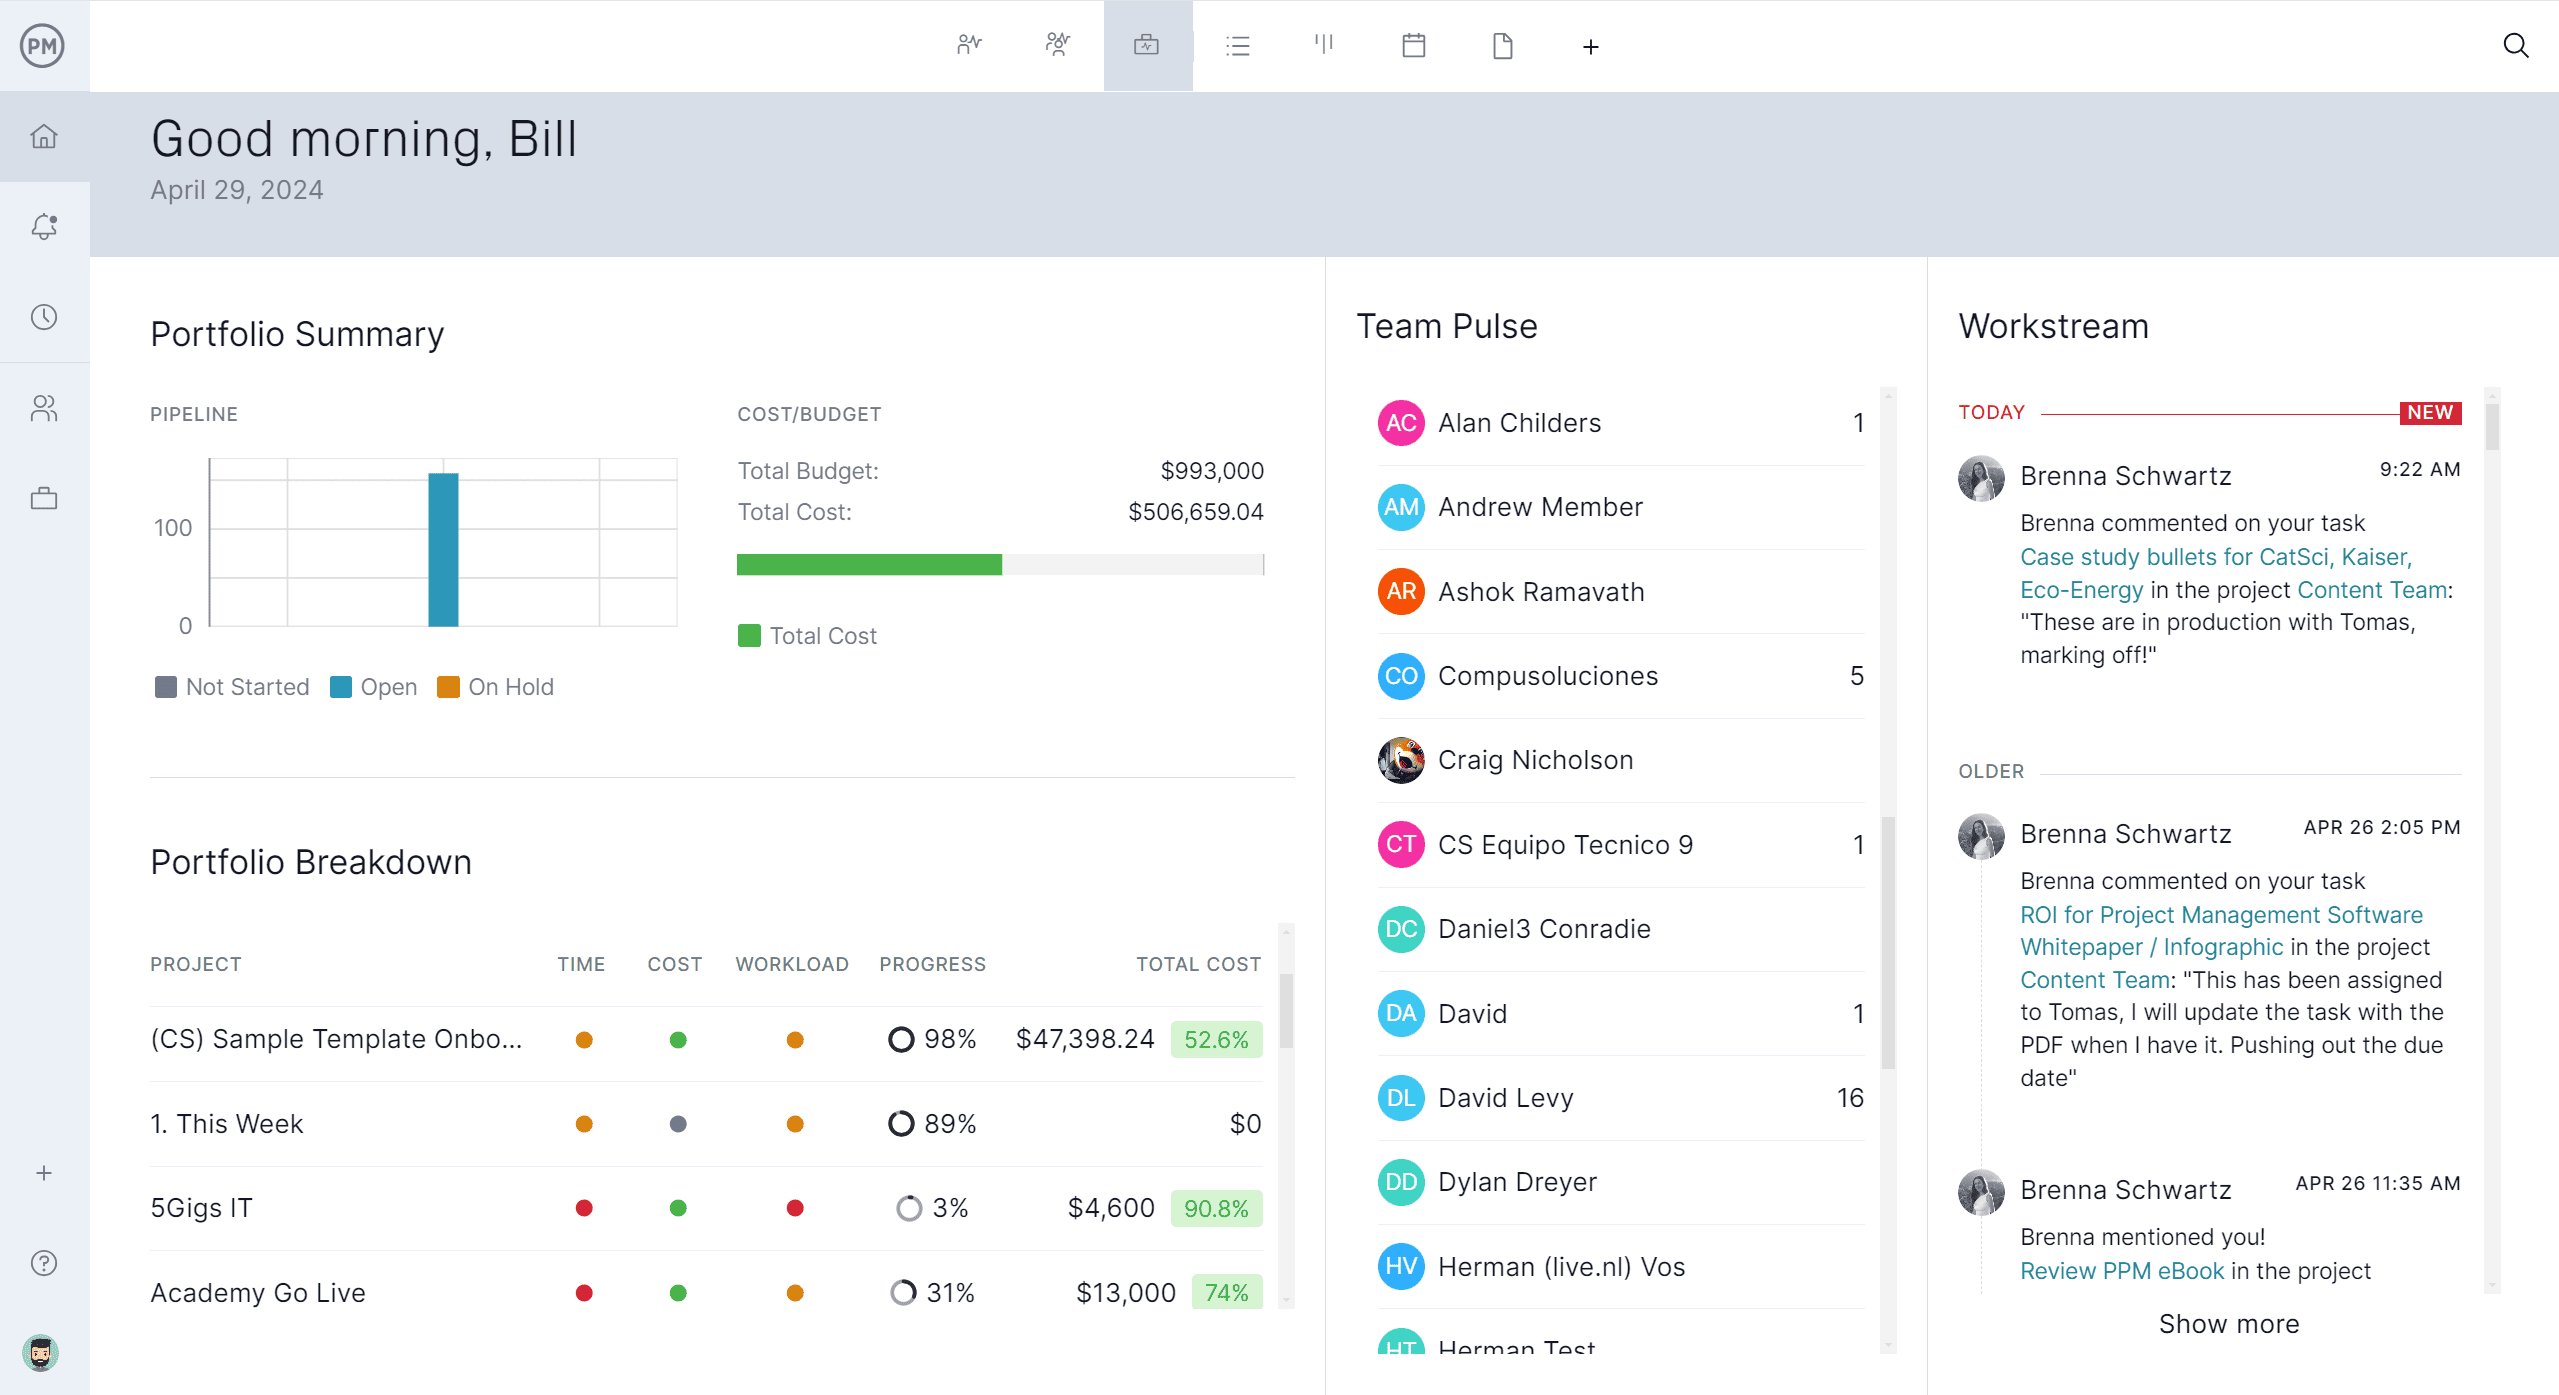
Not everyone needs the full project diagram. ProjectManager’s dashboards give stakeholders an at-a-glance view of project health: tasks completed, budget status, workload by team member and milestone progress, pulled automatically from live project data. No manual updates. No separate status report to write. Just a current view of where the project stands, available to anyone with access.
Related Content
- 25 Free Project Management Templates for Excel
- 10 Free Status Report Templates for Word and Excel
- 10 Free Small Business Plan Templates for Excel and Word
- Work Breakdown Structure Templates
- Free Gantt Chart Templates for Excel
The post 7 Free Project Diagram Templates for Excel and Word appeared first on ProjectManager.