Explaining control charts is difficult due to the unappealing terminology in quality management. Terms like “control charts” and “Statistical Process Control” can deter understanding. Alternative names like “process behavior charts” haven’t improved appeal either. Given the popularity of user-friendly tracking on smart devices, there’s a need to rebrand these tools to make them more accessible and engaging.
Smart Performance Charts (SPC)


Related Posts

The Importance of Salesforce Testing for Business Success
Table of Contents An Overview of Salesforce Types of Salesforce Testing Salesforce Testing Requirements Business Benefits of Salesforce…

Industry Groups Weigh in on Recent Trump, Other Economic Activity
In the past week, NAM and AMT released comment on a number of recent economic issues affecting manufacturing.
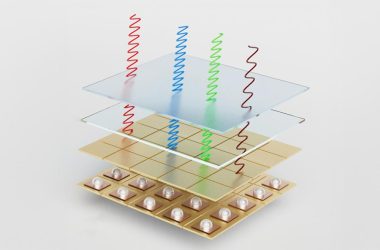
Image Sensor Breakthroughs Bring SWIR Imaging Mainstream
Due to advancements in sensor technology, shortwave infrared (SWIR) imaging is gaining traction in industrial applications. This growth…