So, about 3 weeks ago, I saw this chart, that got me thinking.
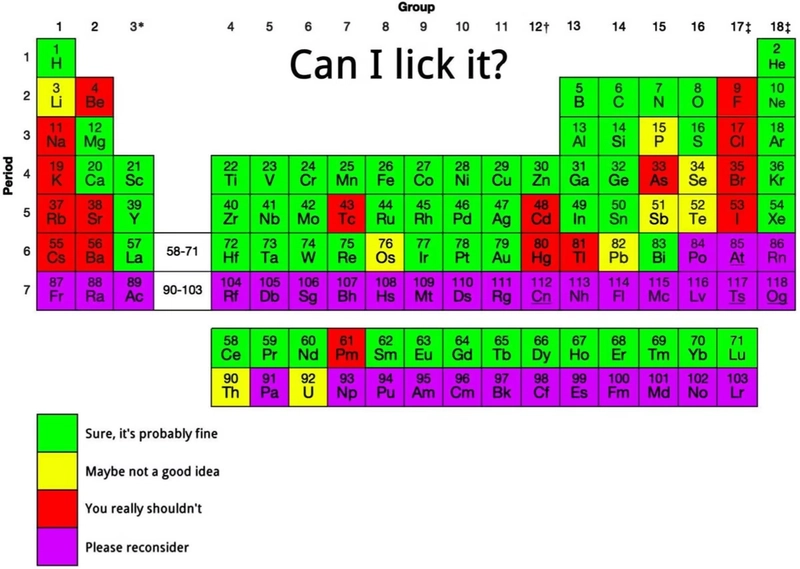
I had the “brilliant” idea to turn this chart into an HTML, CSS, JS, and JSON program to turn this chart into a website.
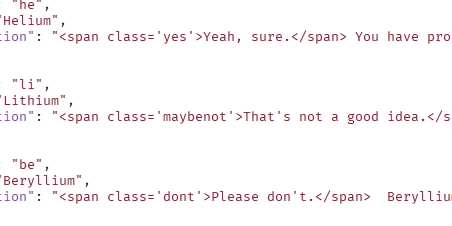
I decided, that for each element, users would be able to see the name, symbol, and a brief description of the element and if you can lick it. At first, I was going to have a bunch of JS conditionals, but that would have been a nightmare, so I have decided to use a JSON file with all of the data. Issue… There are 118 elements to the periodic table, and each element takes around 5 lines of JSON data, meaning that the JSON file alone will have around 590 lines of data. That’s a lot.
I am about halfway through with around 280 lines written. I have spent 3 weeks on and off. This is really annoying.
I am using the VS Code Extension “Getting Fish-Shaped Crackers Back In Vending Machines,” or “fishcracker” to connect VS Code to Glitch, where my project is hosted. This extension is beta, but works great. It’s nice not having to save my file, because Glitch automatically backs it up.
I am going to try to post weekly. I don’t know how much progress I will make though. This JSON data is really boring.
Thanks!