Introduction:
Hey fam🌟 In the fast-changing tech world of today, keeping an eye on the health of your apps has become the key to a smooth user experience. What do you know? Kubernetes is here to help you handle containers at scale as your trusted helper. But how do you keep track of all these bits of code that are flying around? Here come Prometheus and Grafana, a powerful pair that turns data into superhero insights.

Prometheus 📈
It is your measurements guru. It’s an open-source wizard that not only gets data from your apps and services, but also adds some alerting magic. It’s like having your own treasure chest full of info.
- Open source monitoring tool
- Out-of-the-box monitoring capabilities for the Kubernetes
- It collects and stores metrics as time-series data, recording information with a timestamp
- Works by pulling and collecting metrics from targets by scraping metrics HTTP endpoints.
Next, meet
Grafana 📊
It is your visual storyteller. It uses Prometheus data to create eye-catching visualizations. Think of your data as vibrant graphs that tell the story of your apps’ performance and alert you to potential problems before they arise.
- Open source visualization and analytics software.
- It helps you to query, visualize, alert on, and even explore your metrics.
In this guide, we will set up Prometheus to watch your Kubernetes cluster and invite Grafana to the party. Whether you’re an experienced Kubernetes user or just starting out, we’ve got you covered with everything you need to know to set up a rock-solid tracking system.

So our Key Components are
Key components:
- Prometheus server — Processes and stores all your metrics data
- Alert Manager — The manager sends alerts to any systems/channels
- Grafana — Visualize all scraped data in your UI

Let’s Go!!!!!!!!!!!!!!!!!
Installing
There are many ways to setup Prometheus and Grafana. Let us look at some of them:
-
Set up your Prometheus and Grafana configuration files and run them in the correct order.
-
Prometheus Operator: Used to streamline and automate the administration of your Prometheus monitoring stack in your Kubernetes environment.
-
Helm Chart (Recommended) : Using Helm Chart, set up and Prometheus Operator which includes Grafana.
Why Helm ?
Helm is a package manager for Kubernetes. In other words, it simplifies the setting up and installation of all the components of an installation, all in one command. It is recommended to use Helm as it will take care of all the config steps and you would not miss any.
Helm has three significant benefits that it adds to the process of app deployments to the Kubernetes cluster:
- Speed of Deployment – It helps us speed up our speed of app deployments with a single command.
- Using prebuilt application configurations – Whatever the config that you need for your infrastructure, someone else already has a prebuilt application configurations that can be used.
- Easy rollbacks – Last but not least, Helm makes it more easy for us to upgrade and rollback the versions of our apps.
So let us look at our prerequisites
Pre-requisites
- Setup Kubernetes (Using Kubeadm)
- Install Helm Package manager
- Download the Helm charts for setting up Prometheus and Grafana
Let us Get Started!
Creating our Infrastructure
We will be setting up our Kubernetes cluster on AWS, using Kubeadm. I will be using two (2) t2.medium ec2 instances for this installation.

Installing Kubernetes using Kubeadm
Step 1
We will ssh into the 2 VMs (the one we will use as MASTER & WORKER node) and run some commands there to configure the environment.
apt-get update -y

apt-get install docker.io -y

service docker restart

curl -s https://packages.cloud.google.com/apt/doc/apt-key.gpg | apt-key add -

echo "deb http://apt.kubernetes.io/ kubernetes-xenial main" >/etc/apt/sources.list.d/kubernetes.list

apt-get update
Step 2
Now we need to configure the MASTER NODE. So now we will ssh into it and run some commands
kubeadm init --pod-network-cidr=192.168.0.0/16

# If above one fails then run below command

kubeadm token create --print-join-command
Step 3
Let us proceed with our installation in the MASTER NODE
mkdir -p $HOME/.kube

sudo cp -i /etc/kubernetes/admin.conf $HOME/.kube/config

sudo chown $(id -u):$(id -g) $HOME/.kube/config
Step 4
Next, we need to run some kubectl commands on our Master Node to complete the installation
kubectl apply -f https://raw.githubusercontent.com/projectcalico/calico/v3.25.1/manifests/calico.yaml


kubectl apply -f https://raw.githubusercontent.com/kubernetes/ingress-nginx/controller-v0.49.0/deploy/static/provider/baremetal/deploy.yaml

(after that check "kubectl get nodes" command on master node you can see the worker node configured with master)
Let us look at what it looks like now

Installing Helm
Now we can install Helm on our master node. For that, you can run these commands.
curl -fsSL -o get_helm.sh  https://raw.githubusercontent.com/helm/helm/master/scripts/get-helm-3

chmod 700 get_helm.sh

./get_helm.sh

Setting up our Monitoring Environment
Now that we have installed Helm Package Manager we need to add Helm Stable Charts for our local machine.
helm repo add stable https://charts.helm.sh/stable
![]()
Next, we will be adding the Helm repository of prometheus to our local machine
helm repo add prometheus-community https://prometheus-community.github.io/helm-charts
Next we need to create the namespace where we will install prometheus
kubectl create namespace prometheus
We can now go ahead and install our kube-prometheus stack. The kube-stack-prometheus will be installed with Helm, with a grafana deployment embedded.
helm install stable prometheus-community/kube-prometheus-stack --version 48.3.1 -n prometheus
-nis added to specify the namespace where you want the installation to be done.
Having installed it … this is the screen we will have next

Great Job!!!!! It is successfully installed. Now let us go ahead and check our pod resources
kubectl get pods -n prometheus

kubectl get svc -n prometheus

These all show that broth Prometheus and Grafana have been successfully installed.
Enabling external access to our Infrastructure
When a Kubernetes cluster has been created, Cluster IP is usually created. However, for us to be able to enable external access, we need to have a LoadBalancer or NodePort service.
For that, we will therefore need to edit the Prometheus and Grafana service. Run the following command
kubectl edit svc stable-kube-prometheus-sta-prometheus -n prometheus

kubectl edit svc stable-grafana -n prometheus

Once you finish editing both services, make sure that you close and save the file -> Escape :wq
Now we should have 2 loadbalancers in our Cluster. Let us check that

Now we can access Grafana. So copy the Loadbalancer link.
![]()

Configuring our Grafana server
Grafana dashboards give you instant visual insights, making complex data easier to understand. They also let you watch in real time and help you make decisions based on data.
We can create different kinds of dashboards, depending on our needs.
Grafana dashboards are very easy to create. Let us go through the steps to create our dashboard. In your Grafana server, go ahead and create our dashboards.
1. Creating Kubernetes Monitoring Dashboard
- Click + button on left panel and select ‘Import’
- Enter 12740 dashboard id under Grafana.com Dashboard
- Click ‘Load’
- Select ‘Prometheus’ as the endpoint under
Prometheus Data Sourcesdrop down. - Click ‘Import’
This DASHBOARD will show monitoring dashboard for all the nodes in our cluster.

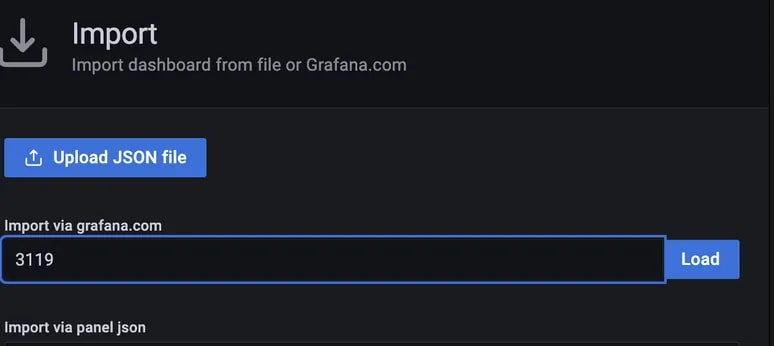
2. Creating Kubernetes Cluster Monitoring Dashboard
- Click + button on left panel and select ‘Import’
- Enter 3119 dashboard id under Grafana.com Dashboard
-
Click ‘Load’
-
Select ‘Prometheus’ as the endpoint under
Prometheus Data Sourcesdrop down.

-
Click ‘Import’

This DASHBOARD will show monitoring dashboard for all the nodes in our cluster.

3. Creating POD Monitoring Dashboard
- Click + button on left panel and select ‘Import’
- Enter 6417 dashboard id under Grafana.com Dashboard
- Click ‘Load’
- Select ‘Prometheus’ as the endpoint under
Prometheus Data Sourcesdrop down. - Click ‘Import’

Congratulations!!!!!!!!!

Conclusion
Your journey to master Prometheus Monitoring on Kubernetes using Grafana is complete! 🚀 You can effortlessly gather, visualise, and analyse metrics from your dynamic Kubernetes system thanks to this hands-on tutorial.
By combining Prometheus’ data collection strength with Grafana’s stunning dashboards, you can confidently sail containerized application into the seas. From resource utilization to anomaly detection and alert setup, you’ve learned key skills for monitoring system health and performance.
Prometheus and Grafana help you optimise, debug, and innovate with Kubernetes and monitoring. Hope your monitoring trip is informative and your applications sparkle! 🌟🌐📊